
(Click on image to enlarge)
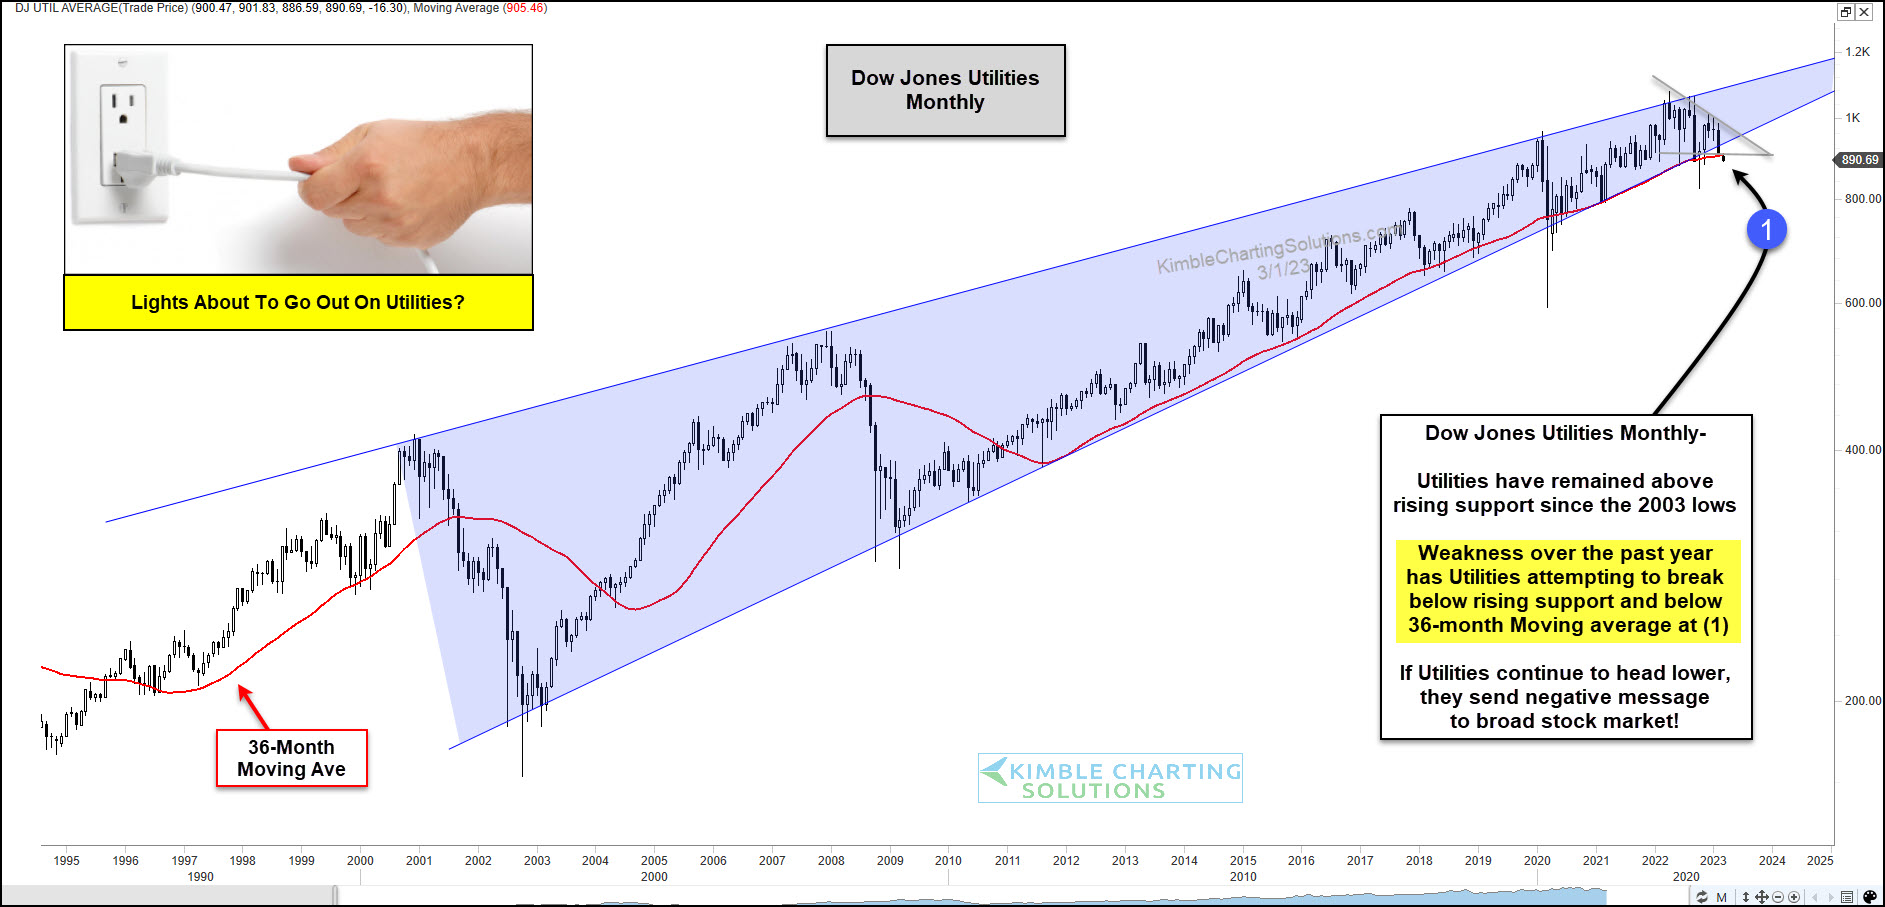
The Dow Jones Utilities Average has enjoyed a 20-year bullish rising price trend.
But a recent multi-month sell-off has bulls on the ropes and wondering if the lights are about to go out on utilities.
Today’s chart is a long-term “monthly” chart of the Dow Jones Utilities Average that captures this bullish trend, along with the recent decline.
As you can see, the Utes are currently testing triple support at (1), comprised of the 20-year rising wedge, 36-month moving average, and the bottom of a newly formed descending triangle.
And considering, the recent weakness, utilities bulls need to hold this support or risk a much bigger decline.
Should the Utes break below support at (1), they will also send a concerning message to the broader stock market. Stay tuned!
More By This Author:
Are DAX (Germany) And CAC-40 (France) Indices About To Send Big Message To Investors?
Utilities Should Experience Huge Move When This Pattern Is Resolved
Here’s Why Commodity Prices May Decline Lower Yet


Comments
Log in or sign up to join the conversation.