
U.S. Stocks - Walmart Inc.
Walmart Inc. (WMT) – Daily and 1H Charts
WMT Elliott Wave Technical Analysis
Daily Chart Overview
Function: Trend
Mode: Impulsive
Structure: Motive
Position: Wave {v}
Direction: Upside in wave {v}
Details: Assumption remains that wave {iv} has bottomed. However, due to the prolonged corrective action, there’s also a possibility that wave (ii) is still unfolding within wave {iv} as a flat correction.
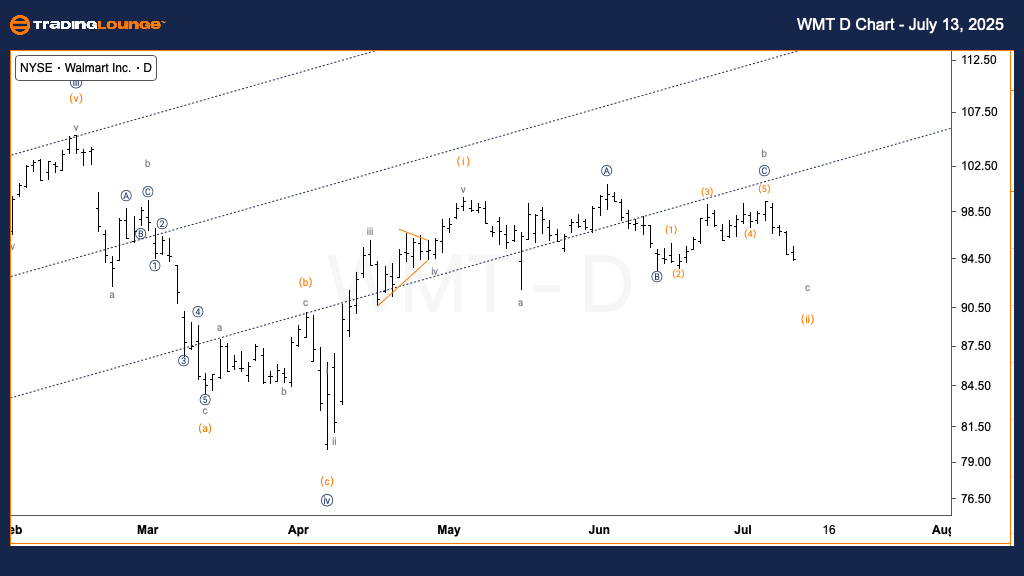
Walmart Inc. (WMT) is currently showing signs of a possible shift into wave {v} on the daily timeframe, contingent upon confirmation that wave {iv} has ended. Despite the bullish assumption, the extended correction introduces an alternative count, suggesting the market might still be developing wave {iv} as a flat within wave (ii).
The structure remains constructive, but bullish confirmation is required before confirming the continuation of the upward trend.
1H Chart Overview
Function: Counter Trend
Mode: Corrective
Structure: Flat
Position: Wave c of (ii)
Direction: Bottoming in wave c
Details: Expecting continued downside toward wave c completion. Equality of wave c versus wave a projects a target at $92.
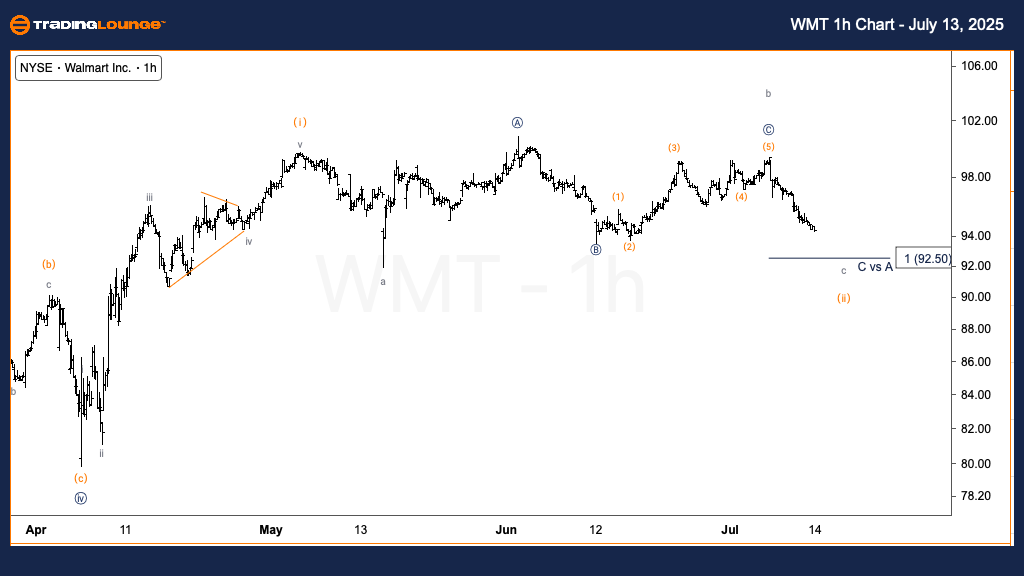
The 1-hour chart shows WMT likely finishing wave c of (ii) within a flat corrective pattern. The projected support level is around $92, aligning with wave c equaling wave a in length.
A bounce from $92 would indicate the correction is ending and wave {v} may soon begin. Until such movement occurs, traders should exercise caution, monitoring for signs of stabilization or reversal before entering new long positions.
Technical Analyst: Alessio Barretta
More By This Author:
U.S. Stocks - Zoom Communications Inc.
Elliott Wave Technical Analysis: Euro/U.S. Dollar - Monday, July 14
Dogecoin Crypto Price News Today - Monday, July 14
At TradingLounge™, we provide actionable Elliott Wave analysis across over 200 markets. Access live chat rooms, advanced AI & algorithmic charting tools, and curated trade ...
more

