
U.S. Stocks CSX Corp.
CSX Elliott Wave Analysis Trading Lounge
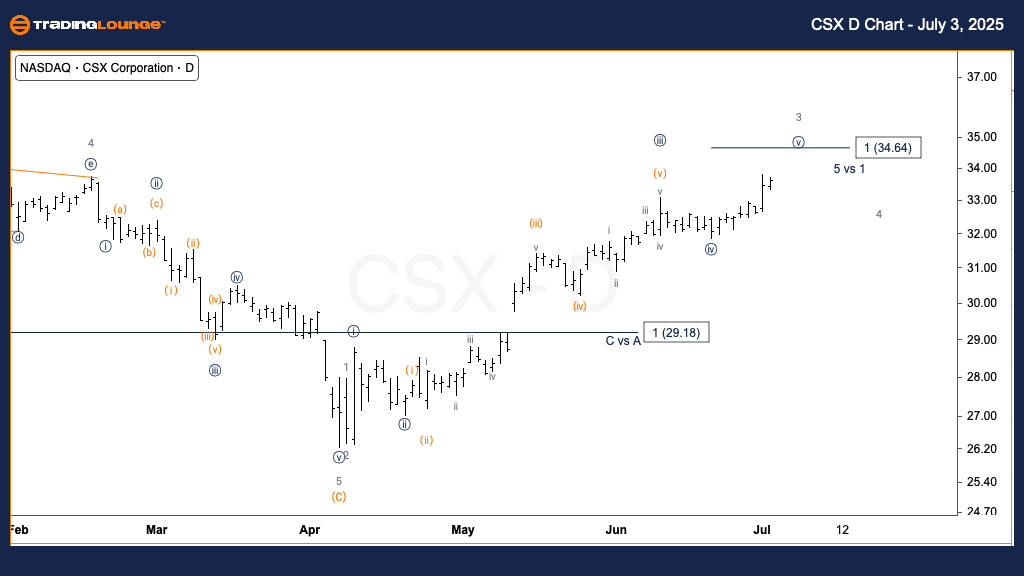
CSX Corp. (CSX) Daily Chart
CSX Elliott Wave Technical Analysis
FUNCTION: Trend
MODE: Impulsive
STRUCTURE: Motive
POSITION: Wave {v} of 3
DIRECTION: Upside in wave {v}
DETAILS: Expecting continuation higher into wave {v} of 3, with wave {i} equality near $35
CSX Corp. (CSX) 1H Chart
CSX Elliott Wave Technical Analysis
FUNCTION: Trend
MODE: Impulsive
STRUCTURE: Motive
POSITION: Wave (iv) of {v}
DIRECTION: Upside in wave (v)
DETAILS: Anticipating one more upward leg in wave (v); potential extension likely as wave (iii) exceeded wave (i).

This analysis provides a technical overview of CSX Corp. (CSX) based on Elliott Wave Theory across two key timeframes.
CSX Daily Chart – Elliott Wave Overview
On the daily chart, CSX continues its upward momentum through wave {v} of 3. This wave is progressing toward the $35 level, aligning with the size of wave {i}. The structure remains impulsive and suggests a strong bullish trend. Wave {v} usually completes the third wave in an Elliott Wave cycle, which is typically the most powerful segment, signaling potential further gains.
CSX 1-Hour Chart – Elliott Wave Breakdown
In the 1-hour chart, CSX is currently forming wave (iv) of {v}, likely setting up the final upward move in wave (v). Because wave (iii) extended beyond wave (i), wave (v) could also continue longer than average. This indicates a possibility of additional upside momentum following the short consolidation phase, possibly pushing the stock price past the $35 benchmark.
Technical Analyst: Alessio Barretta
More By This Author:
Unlocking ASX Trading Success: Coles Group Limited - Thursday, July 3
Elliott Wave Technical Analysis: Euro/U.S. Dollar - Thursday, July 3
Indian Stocks: Bharat Electronics - Thursday, July 3
At TradingLounge™, we provide actionable Elliott Wave analysis across over 200 markets. Access live chat rooms, advanced AI & algorithmic charting tools, and curated trade ...
more

