
US Stock Market Performance In 2019 - Are Small-Cap Stocks Out Of Favor?
US stock market has performed so far very well in 2019 despite important concerns about global economic slowdown and the US-China trade war developments. At the close of the trading session on Friday, October 18, 2019 the year-to-date performance of major stock market indices is the following:
- Dow Jones Industrial Average: 26770.20, YTD Change +14.76%
- S&P 500: 2986.20, YTD Change +19.12%
- Nasdaq Composite: 8089.54, YTD Change + 21.92%
- Russell 2000: 1535.48, YTD Change + 13.86%
Here is the chart of the year-to-date performance for all these 4 major stock market indices
.png)
Clearly the small-cap stocks have underperformed so far in 2019 compared to the 3 major stock market indices. But what is very interesting is a look at the current P/E ratio and dividend yield for all these 4 indices from a valuation perspective.
- Dow Jones Industrial Average: P/E ratio 19.34, Dividend yield 2.32%
- S&P 500: P/E ratio 23.50, Dividend yield 1.93%
- Nasdaq 100: P/E ratio 24.05, Dividend yield 1.03%
- Russell 2000: P/E ratio 41.63, Dividend yield 1.59%
Note: The P/E ratio and Dividend yield are based on the close of 10/18/2018 and using trailing twelve months data.
From a relative valuation perspective, we note that Russell 2000 has the highest P/E ratio and its dividend yield is only higher compared to the dividend yield of Nasdaq 100 Index.
US Sectors Performance in 2019
What about the performance of US Sectors so far in 2019?
This is the performance of the 11 main Sectors again on year-to-date basis at close on Friday October 18, 2019:
- Communication Services: +22.84%
- Consumer Discretionary: +22.69%
- Consumer Staples: +19.46%
- Energy: -0.80%
- Financials: +17.82%
- Health Care: +6.04%
- Industrials: +19.60%
- Information Technology: +30.46%
- Materials: +13.89%
- Real Estate: +28.42%
- Utilities: +20.60%
Best performing sector is again tech stocks with Information Technology +30.46%, worst performing sector is Energy -0.80%
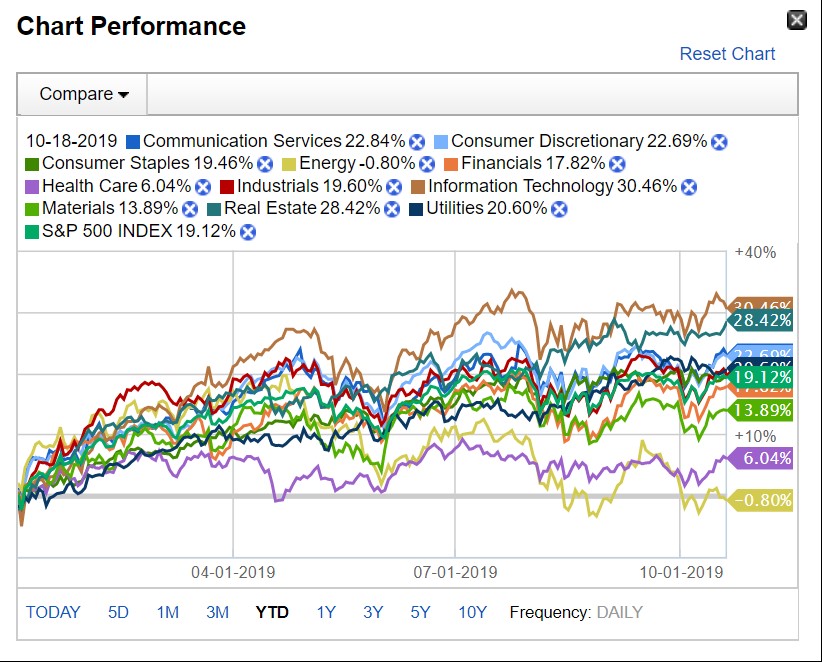
Source: Fidelity research
Small-cap stocks with a P/E ratio less than 2
With the highest P/E ratio among all mentioned stock market indices Russell 2000 seems on a relative valuation to have the most expensive stocks. But a stock screener can reveal small-cap stocks with a P/E ratio less than 2 again based on trailing twelve months period.
5 small-cap stocks with a P/E ratio less than 2 at close October 18, 2019:
- United States Steel Corporation (NYSE:X): Price 10.72, P/E ratio 1.88
- Southwestern Energy Company (NYSE:SWN): Price 2.01, P/E ratio 1.11
- Antero Resources Corporation (NYSE:AR): Price 2.55, P/E ratio 1.07
- Warrior Met Coal, Inc. (NYSE:HCC): Price 21.82, P/E ratio 1.72
- Cleveland-Cliffs Inc. (NYSE:CLF): Price 6.92, P/E ratio 1.76
Source: Yahoo Finance
All these 5 stocks seem to be relative undervalued and cheap but investors should not rely only on their very low P/E ratio to make investment decisions but analyze them with a due diligence, looking at their main financial ratios for the past 3-5 years, recent news, growth prospects and any catalysts that can move these stocks.
Just the fact that Russell 2000 has the highest P/E ratio among all mentioned stock market indices should not be a restrictive investment rule based on valuation. Russell 2000 has underperformed in 2019 compared to all 3 major indices but investors can search for undervalued stocks with solid fundamentals.
Disclosure: I have no position in any stock mentioned


