
Unveiling The Hidden Message In The S&P 500 Price And Volume Trend

Image Source: Unsplash
The subtle price and volume pattern shown up last week could suggest more testing and consolidation in S&P 500. Scenarios analysis with the key levels in S&P 500 were discussed regarding the reaction from the CPI economic data.
Watch the video below to find out how to use the Wyckoff method with volume spread analysis to interpret the hidden message from the price and volume analysis.
Video Length: 00:05:37
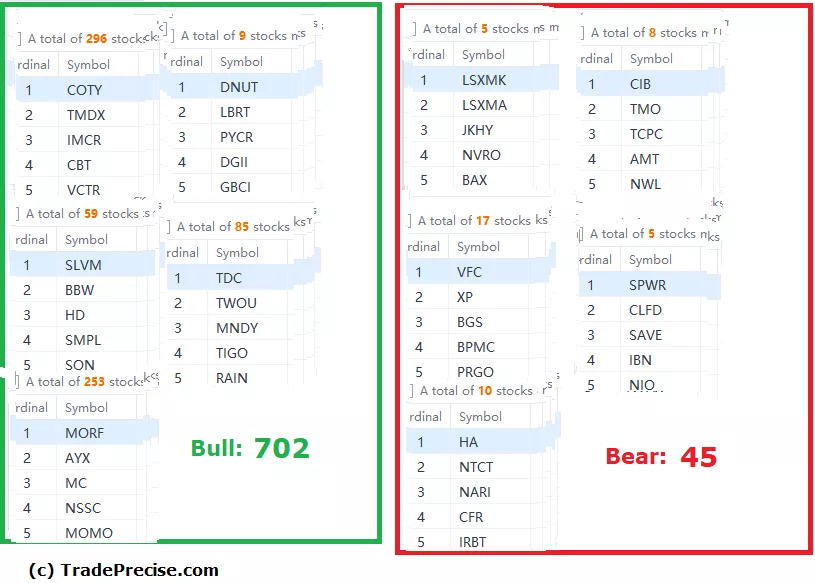
The bullish setup vs. the bearish setup is 702 to 45 from the screenshot of my stock screener below suggested a positive market environment.
Pay attention to the key levels as discussed in the video as a violation of them could suggest more weakness ahead.
Although the market environment is positive as reflected in the stock screener above, the volatility is still high as reflected in the breakout failure in some of the outperforming stocks. So, now is still not the time to be aggressive in trading or investing.
More By This Author:
Coinbase Emerges From Supply Exhaustion: What's Next For The Crypto Giant?
Prolonged Accumulation Pays Off: Impinj On Track For Record-Breaking Rally
The Climatic Run In S&P 500: Topping Pattern Or Sign Of Strength?
Disclaimer: The information in this presentation is solely for educational purpose and should not be taken as investment advice.


