

Image Source: Unsplash
The AES Trade Setup
The utility sector is often seen as a boring place for swing traders to park their cash. You usually don’t get the massive intraday swings or the hype that comes with big tech or AI stocks. But boredom can be a good thing when you are looking for consistency and clean chart patterns. That is exactly what I am seeing right now with The AES Corp (AES).
I have been watching this stock for a few weeks now. It hasn’t been making a lot of noise, but it is setting up in a way that demands attention. Many traders ignore these types of setups because they want immediate gratification. They want the stock that is going to double overnight. But I care about managing risk and finding setups where the reward outweighs that risk. AES is presenting us with exactly that kind of scenario.
If you look at the broader market, we are seeing a lot of indecision. That is why finding individual names that are acting constructively is so important. You can’t just throw darts at a board and expect to make money. You have to be precise. You have to be disciplined. And right now, AES is testing a critical level that could determine its trend for the next several weeks.
(Click on image to enlarge)
The Technical Setup on AES
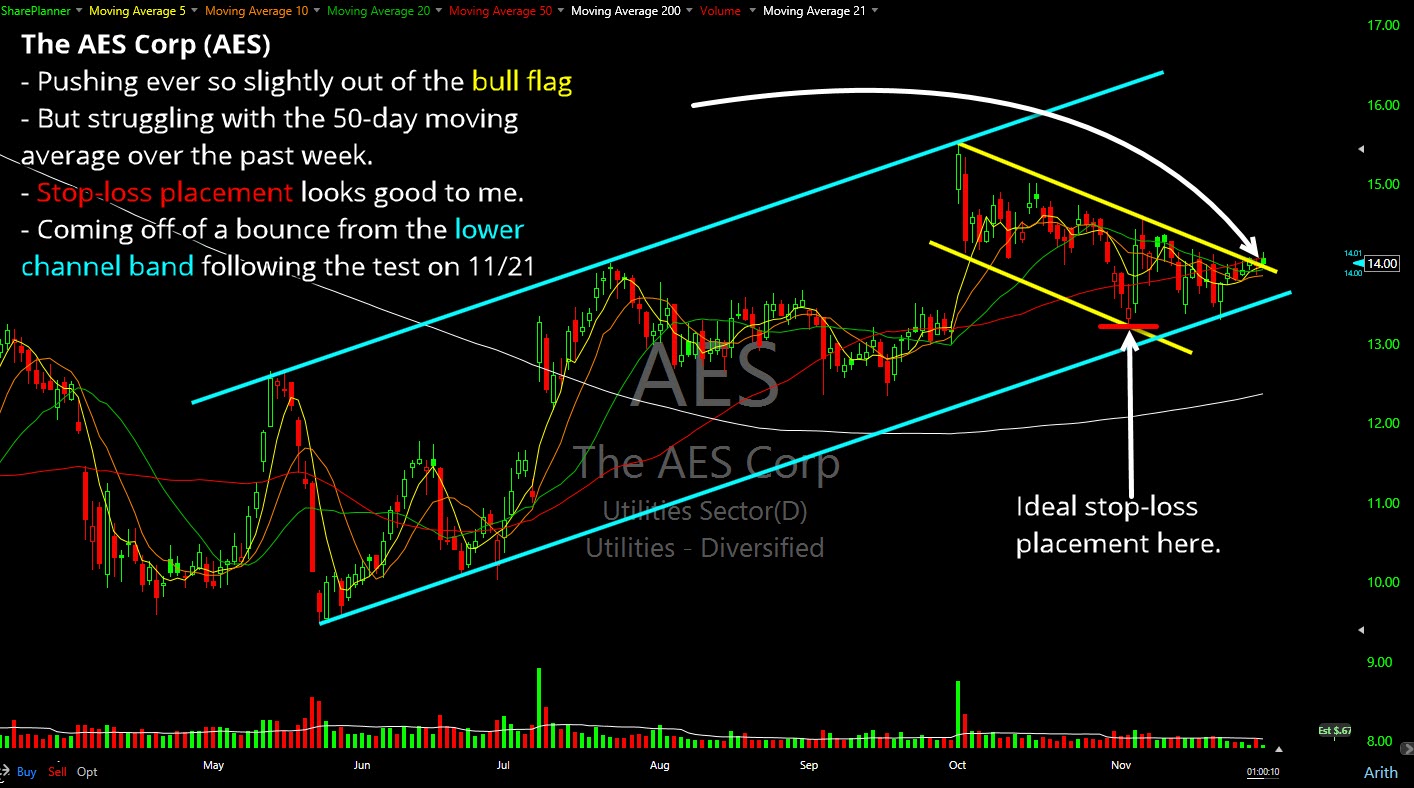
When I pull up the chart for AES, the first thing that jumps out at me is how it is interacting with the 50-day moving average. This is the red line on my chart, and it acts as a major line in the sand for institutional investors.
The stock has been consolidating right around this level. It is not seeing price necessarily rejected at it, but it isn’t launching off it yet either. Instead it’s coiling. This is what we call price compression. The energy is building up, and sooner or later, it has to release. As swing traders, our job isn’t to guess which way it will go. Our job is to be ready to act when the move happens.
Now, you also have a really well developed bull flag pattern as well (yellow parallel lines), and attempting to break out of that and hold that level today. Although overall, I wouldn’t call it an impressive break. I need to see some conviction out of price to show that there’s some legs to this break out of the bull flag.
Managing The Risk
You have heard me say this a thousand times, but it bears repeating: managing risk is where you have the most control in your trading. You cannot control where the stock goes, but you can control how much you lose if it goes against you (assuming you don’t hold through earnings or a major gap lower of course!).
For this trade in AES, the risk management is straightforward. If I enter this position on a breakout above the 50-day moving average, my stop-loss needs to be just below the recent consolidation lows (i.e. bull flag lows). I want to give the trade enough room to breathe so I don’t get whipped out of my position by normal volatility, but not so much room that a loss turns into a portfolio disaster.
You also have the rising trend-line, which is part of a broader channel that the stock is trading in and tested late last month and held (whatever that blue color is called on the chart). That level provides another layer of support for the stock as well, and makes it that much more difficult to break through.
Here is my plan for managing this specific trade:
- Entry Trigger: I am waiting, at the very least, for a close above the 50-day moving average.
- Stop-Loss: Placed strictly below the recent bull flag lows to invalidate the setup.
- Position Sizing: I will start with a standard position size, but if momentum stalls, I’ll likely dump it.
- Target: I am looking for a move back to the recent highs for some profit taking, which gives us a solid reward-to-risk ratio, but ultimately want to see it hit the upper channel band.
This approach takes the emotion out of the equation. I know exactly where I am getting in, and more importantly, I know exactly where I am getting out if I am wrong.
How To Trade AES
Patience is going to be key here. It is very tempting to jump in early because you think the breakout is inevitable. I have made that mistake plenty of times in my career, and it usually results in buying the top of a failed move.
We need to wait for confirmation. Let the market prove to you that it wants to go higher. Watch the volume as price approaches that 50-day moving average. If we see volume picking up as price pushes through, that is your green light.
Once you are in the trade, trust your plan. Don’t stare at the 1-minute chart and panic over every tick. Let the trade work. If it hits your stop, you get out. No questions asked. If it hits your target, take some profits and let the rest run as long as it is willing to run. Trading is simply about executing your plan over and over again.
Don’t Let Emotions Dictate Your Trade
The hardest part about a setup like this isn’t the technical analysis. It is the waiting. It is the discipline to sit on your hands until the setup triggers. AES looks promising, but until it reclaims that 50-day moving average, it is just a stock on a watchlist.
Keep your eye on the level. Set your alerts so you don’t have to stare at the screen all day, so you know when it breaks the 50-day MA. When the trade is validated, execute your plan with confidence. That is how you survive in this game for the long haul. You treat it like a business, not a casino.
More By This Author:
Is Warren Buffett’s GOOGL Bet A Good One?Is Tesla’s Bull Run Coming To An End?
VIX Higher Low


Comments
Log in or sign up to join the conversation.