
Summary
- 88% technical buy signals.
- 19 new highs and up 15.52% in the last month.
- 56.03% gain in the last year.
The Barchart Chart of the Day belongs to the electronic trading company Tradeweb Markets (Nasdaq: TW). I found the stock by sorting the stock of the Russell 3000 Index first by the most frequent number of new highs in the last month, then used the Flipchart feature to review the charts for consistent price appreciation. Since the Trend Spotter signaled a buy on 10/25 the stock gained 9.80%.

Tradeweb Markets Inc. builds and operates electronic marketplaces in the Americas, Europe, the Middle East, Africa, Asia Pacific, and internationally. The company's marketplaces facilitate trading in a range of asset classes, including rates, credit, money markets, and equities. It offers pre-trade data and analytics, trade execution, and trade processing, as well as post-trade data, analytics, and reporting services. The company provides flexible order and trading systems to institutional investors in 40 markets across 25 currencies. It also offers a range of electronic, voice, and hybrid platforms to approximately 300 dealers and financial institutions on electronic or hybrid markets with Dealerweb platform; and trading solutions for financial advisory companies and traders with Tradeweb Direct platform. The company serves a network of approximately 2,500 clients in the institutional, wholesale, and retail client sectors. Its customers include asset managers, hedge funds, insurance companies, central banks, banks and dealers, proprietary trading firms, retail brokerage and financial advisory firms, and regional dealers. The company was founded in 1996 and is headquartered in New York, New York. Tradeweb Markets Inc. is a subsidiary of BCP York Holdings.
(Click on image to enlarge)
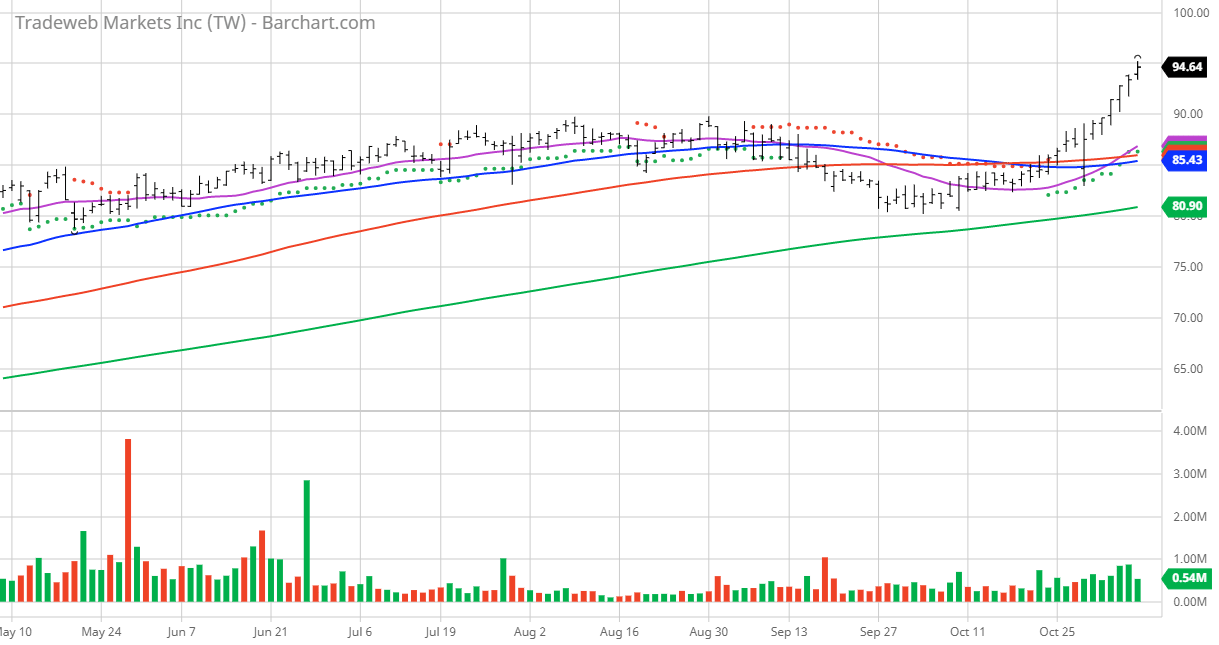
Barchart technical indicators:
- 88% technical buy signals
- 55.49+ Weighted Alpha
- 56.03% gain in the last year
- Trend Spotter buy signal
- Above its 20, 50 and 100 day moving averages
- 19 new highs and up 15.52% in the last month
- Relative Strength Index 82.81%
- Technical support level at 92.15
- Recently traded at 94.37 with a 50 day moving average of 85.44
Fundamental factors:
- Market Cap $21.71 billion
- P/E 61.87
- Dividend yield .34%
- Revenue is expected to grow 20.50% this year and another 11.00% next year
- Earnings are estimated to increase 244% this year, an additional 14.10% next year and continue to compound at an annual rate of 16.15% for the next 5 years
- Wall Street analysts issued 4 strong buy, 3 buy, 6 hold and 1 under perform recommendation on the stock
- The individual investors monitoring the stock on Motley Fool voted 173 to 12 that the stock will beat the market with the more experienced investors voting 35 to 2 for the same result
- 3,530 investors are monitoring the stock on Seeking Alpha


Comments
Log in or sign up to join the conversation.