

Image Source: Pixabay
The S&P 500 Index is off to a challenged start to the year. So far in 2025, the S&P 500 Index has declined 3%.
Many dividend stocks are off to much worse starts year-to-date, which could present value and income investors with some compelling buying opportunities.
To begin the search for quality dividend growth stocks, we recommend the Dividend Champions, a group of stocks that have increased their dividends for at least 25 consecutive years.
Investors are likely familiar with the Dividend Aristocrats, a group of 69 stocks in the S&P 500 Index with 25+ consecutive years of dividend increases.
Meanwhile, investors should also familiarize themselves with the Dividend Champions, which have also raised their dividends for at least 25 years in a row.
This article will discuss the 3 worst-performing Dividend Champions so far in 2025, along with their expected returns over the next five years.
Beaten Down Dividend Champion #3: Matthews International Corp. (MATW)
- Year-to-Date Performance: -15.6%
- 5-year expected returns: 12.2%
Matthews International Corporation provides brand solutions, memorialization products and industrial technologies on a global scale. The company’s three business segments are diversified.
The SGK Brand Solutions provides brand development services, printing equipment, creative design services, and embossing tools to the consumer-packaged goods and packaging industries.
The Memorialization segment sells memorialization products, caskets, and cremation equipment to funeral home industries.
The Industrial technologies segment is smaller than the other two businesses and designs, manufactures and distributes marking, coding and industrial automation technologies and solutions.
Matthews International reported first quarter FY 2025 results on February 6th, 2025. The company reported sales of $402 million, an 11% decline compared to the same prior year period. The decrease was the result of a 28% sales decline in its Industrial Technologies segment.
Adjusted earnings were $0.14 per share, a 62% decrease from $0.37 a year ago. The company’s net debt leverage ratio rose from 3.6 one year ago to 3.9.
Matthews continues to expect $205 million to $215 million of adjusted EBITDA for fiscal 2025.
The dividend payout ratio for Matthews International has been very conservative and only recently eclipsed one third of earnings. This conservative payout ratio allows Matthews to continue raising the dividend as it has for the last 31 years.
The company has a small competitive advantage in that it is uniquely diversified across its businesses, which allows it to weather different storms on a consolidated basis.
Click here to download our most recent Sure Analysis report on MATW (preview of page 1 of 3 shown below):

Beaten Down Dividend Champion #2: T. Rowe Price Group (TROW)
- Year-to-Date Performance: -16.0%
- 5-year expected returns: 13.6%
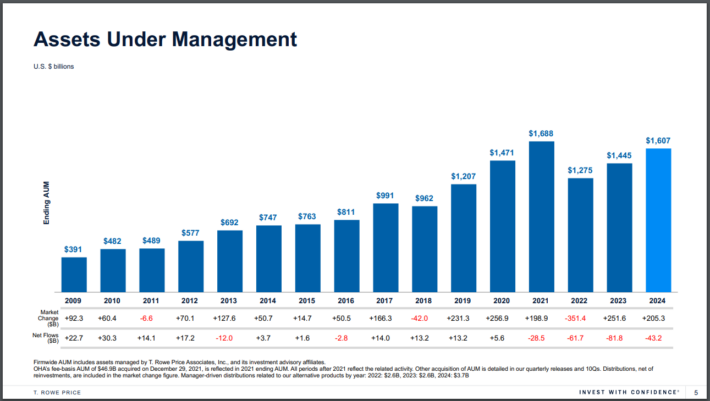
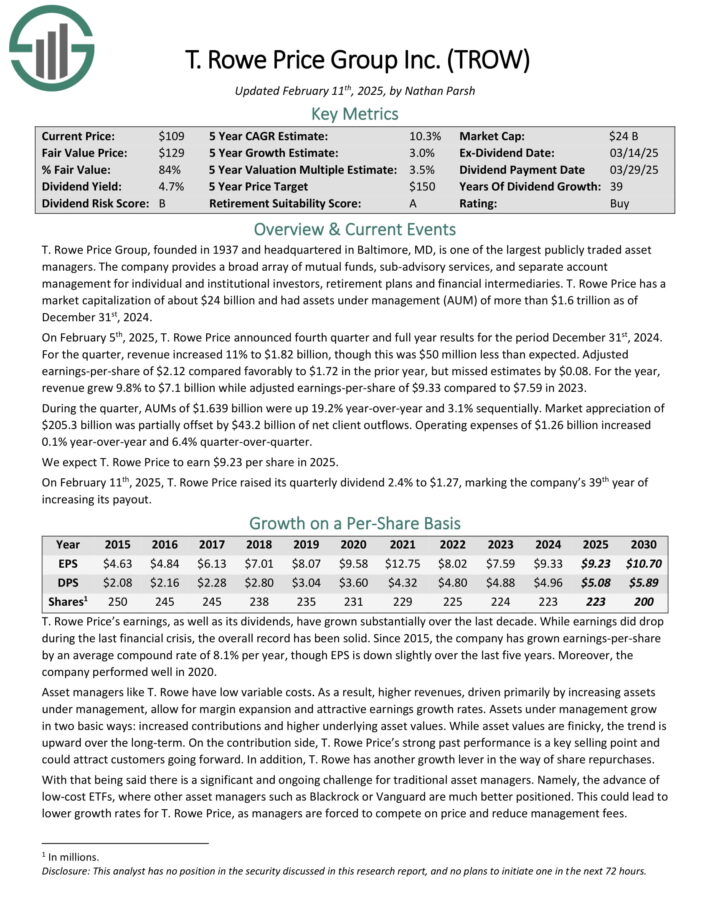
T. Rowe Price Group, founded in 1937 and headquartered in Baltimore, MD, is one of the largest publicly traded asset managers.
The company provides a broad array of mutual funds, sub-advisory services, and separate account management for individual and institutional investors, retirement plans and financial intermediaries.
Source: Investor Presentation
Assets under management grow in two basic ways: increased contributions and higher underlying asset values. While asset values are finicky, the trend is upward over the long term.
In addition, T. Rowe has another growth lever in the form of share repurchases. The company has shrunk its share count by an annual rate of 1.3% over the last decade.
On February 5th, 2025, T. Rowe Price announced fourth quarter and full year results for the period December 31st, 2024.
For the quarter, revenue increased 11% to $1.82 billion, though this was $50 million less than expected. Adjusted earnings-per-share of $2.12 compared favorably to $1.72 in the prior year, but missed estimates by $0.08.
For the year, revenue grew 9.8% to $7.1 billion while adjusted earnings-per-share of $9.33 compared to $7.59 in 2023.
During the quarter, AUMs of $1.639 billion were up 19.2% year-over-year and 3.1% sequentially. Market appreciation of $205.3 billion was partially offset by $43.2 billion of net client outflows.
Operating expenses of $1.26 billion increased 0.1% year-over-year and 6.4% quarter-over-quarter.
Click here to download our most recent Sure Analysis report on TROW (preview of page 1 of 3 shown below):
Beaten Down Dividend Champion #1: Target Corporation (TGT)
- Year-to-Date Performance: -20.9%
- 5-year expected returns: 13.6%
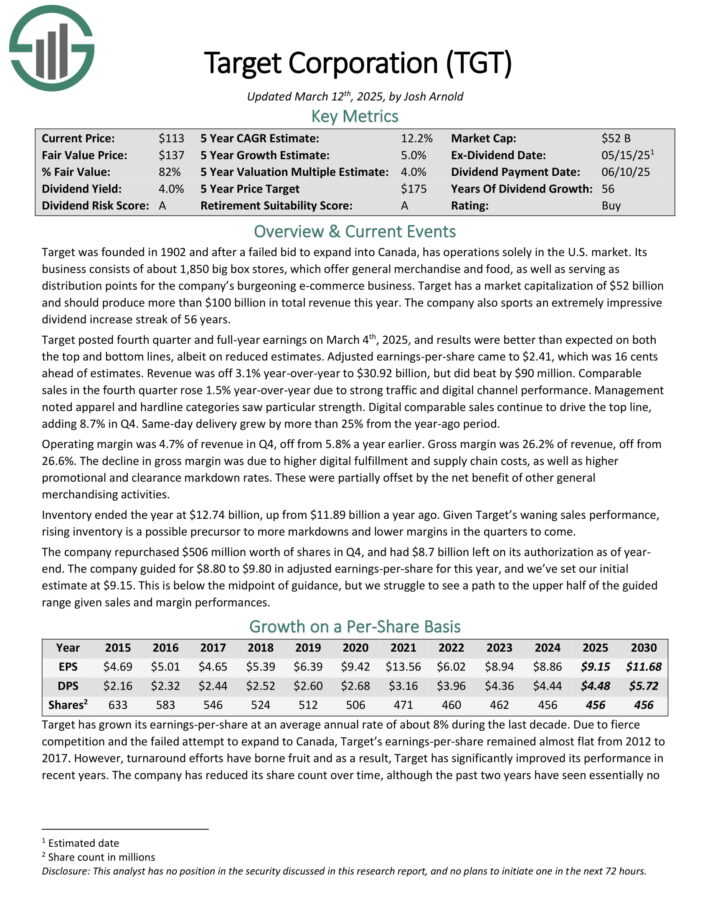
Target was founded in 1902 and now operates about 1,850 big box stores, which offer general merchandise and food, as well as serving as distribution points for the company’s e-commerce business.
Target posted fourth quarter and full-year earnings on March 4th, 2025, and results were better than expected on both the top and bottom lines, albeit on reduced estimates. Adjusted earnings-per-share came to $2.41, which was 16 cents ahead of estimates.
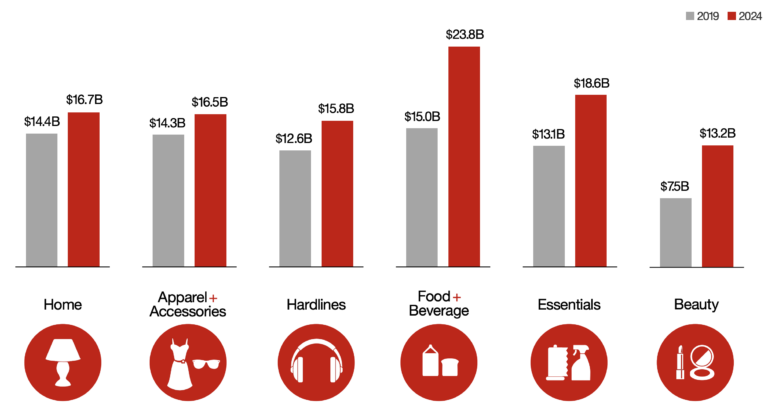
Revenue was off 3.1% year-over-year to $30.92 billion, but did beat estimates by $90 million. Comparable sales in the fourth quarter rose 1.5% year-over-year due to strong traffic and digital channel performance.
Management noted apparel and hardline categories saw particular strength.
Source: Investor Presentation
For 2025, Target expects around 1% sales growth and a modest increase in operating margins. However, factors like tariff uncertainties and shifting consumer confidence may pressure short-term profits.
The company remains focused on digital expansion, supply chain improvements, and shareholder returns, including dividend increases and stock buybacks, with $8.7 billion still available under its repurchase program.
Digital comparable sales continue to drive the top line, adding 8.7% in Q4. Same-day delivery grew by more than 25% from the year-ago period.
The company repurchased $506 million worth of shares in Q4, and had $8.7 billion left on its authorization as of year end. The company guided for $8.80 to $9.80 in adjusted earnings-per-share for this year.
Click here to download our most recent Sure Analysis report on TGT (preview of page 1 of 3 shown below):
More By This Author:
10 Best Dividend Stocks Trading Near 52-Week Lows3 Undervalued High Dividend Stocks
Stop Chasing Returns And Start Getting Rising Dividends With These 10 Blue Chip Stocks


Comments
Log in or sign up to join the conversation.