Three Charts Every Trader Needs To See Today
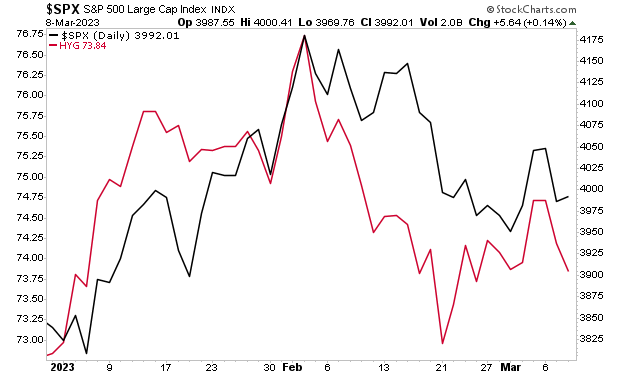
High yield credit is turning back down again.
(Click on image to enlarge)

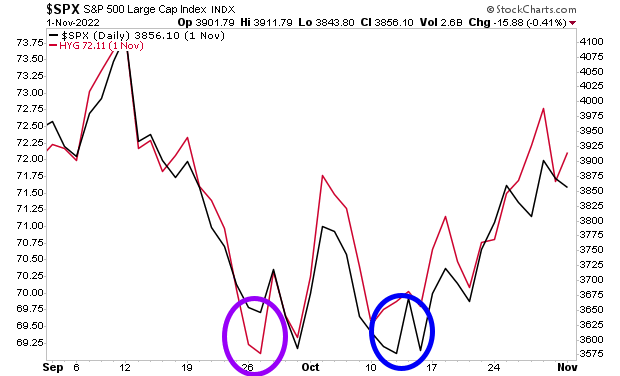
This is a big deal as historically high yield credit leads stocks.
Indeed, high yield credit bottomed in October 2022 (purple circle in the chart below) a full two weeks before stocks did (blue circle in the chart below).
(Click on image to enlarge)

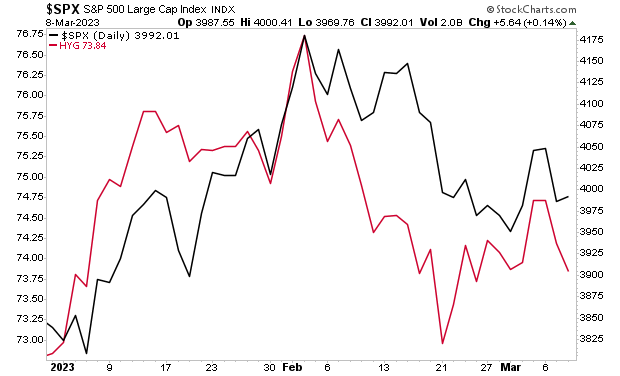
Now high yield credit is telling us stocks are set to drop. According to high yield credit, the S&P 500 should already be at 3,900 a full 100 points lower.
(Click on image to enlarge)

Oh… and by the way… our proprietary Bear Market Trigger… the one that predicted the Tech Crash as well as the Great Financial Crisis… is on a confirmed SELL signal for the first time since 2008.
If you’ve yet to take steps to prepare for what’s coming, we just published a new exclusive special report How to Invest During This Bear Market.
It details the #1 investment to own during the bear market as well as how to invest to potentially generate life changing wealth when it ends.
More By This Author:
Is The Great Debt Crisis Of Our Lifetimes Finally Going To Arrive?The Next Major Downdraft Is Approaching
The Bubble is Back… And It’s Bursting Will Only Be That Much Worse


