
Stocks broke down badly over the last two days.
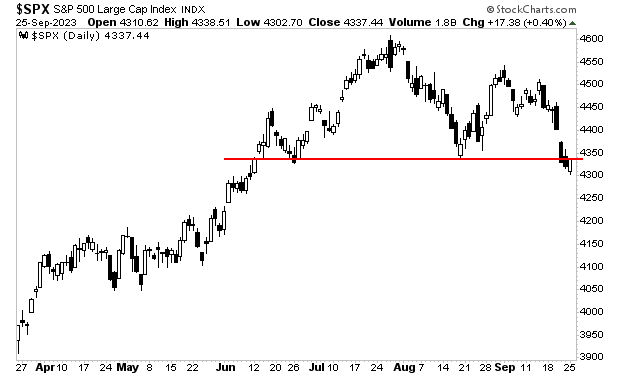
The line in then sand for the S&P 500 was 4,460. Stocks broke through it on Friday. They failed to reclaim it yesterday. This is quite bearish.
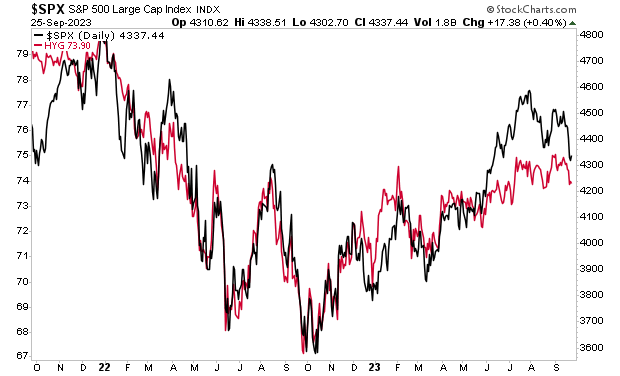
Unfortunately, there’s more room to go for this drop. High yield credit which usually leads stocks is showing us what’s coming.
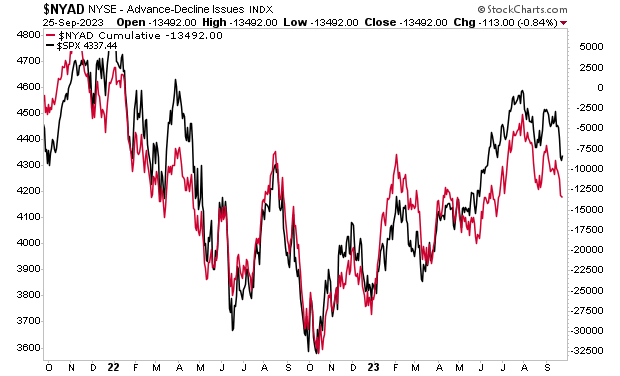
The picture is even uglier when we take a look at market breadth. Again, this usually leads the index.
If you’ve yet to take steps to prepare for what’s coming, we just published a new exclusive special report How to Invest During This Bear Market.
It details the #1 investment to own during the bear market as well as how to invest to potentially generate life changing wealth when it ends.
Normally this report would be sold for $249. But we are making it FREE to anyone who joins our Daily Market Commentary Gains Pains & Capital.
More By This Author:
I Sincerely Hope This Chart Doesn’t Come TrueThe Single Most Important Bond In The World Is Breaking Down
The Great Debt Crisis of Our Lifetimes Is Just Around the Corner - Are You Ready?


Comments
Log in or sign up to join the conversation.