
These Go To 11: Diversification With S&P 500 Sectors
Many strategies (including passive ones) hold large allocations to Information Technology. A “barbell” approach can mitigate risk from high exposure to one sector by pairing it with another.
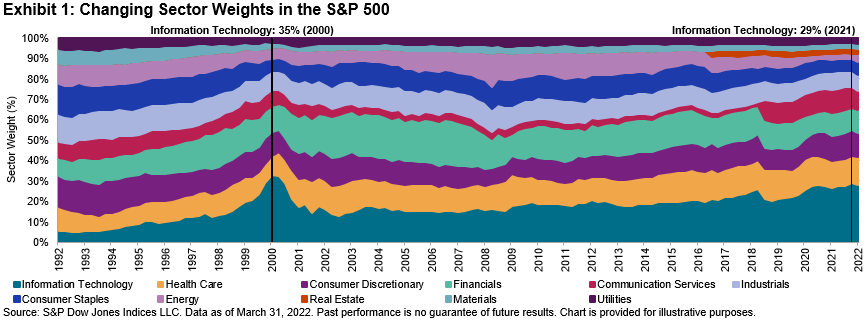
Do you remember sending your first email? For many, it was likely around the mid-1990s when a “googol” was still 10^100 rather than a verb and the @ key on your keyboard was seldom used. The world has changed indeed. In 1995, the Information Technology sector comprised just 10% of the S&P 500® but soon rocketed to 35% by March 2000 before a bursting bubble started its Icarian descent back below 20% (see Exhibit 1). By 2021, Information Technology reached a peak weight of 28% as the largest of the 11 S&P 500 sectors before leading the market downward this year.
(Click on image to enlarge)
Because each S&P 500 sector uses the Global Industry Classification Standard® (GICS®) to group businesses that are similar, sectors tend to exhibit non-aligned periods of outperformance. On any given day since December 2000, 51% of sectors have outperformed over a trailing six-month period. We find that whenever Information Technology has underperformed the S&P 500 during a six-month period, all 10 other GICS sectors have, on average, outperformed the benchmark (see Exhibit 2).
(Click on image to enlarge)

A recent example of sectors exhibiting different performance profiles can be seen in Energy and Information Technology since the emergence of COVID-19 in December 2019 (see Exhibit 3). While Information Technology has exhibited defensive resilience during the pandemic-related tumult, it has traditionally been viewed as a more cyclical sector that benefits from periods of economic strength and market optimism toward future earnings, Energy tends to be a necessary purchase for consumers and businesses throughout the economic cycle (barring pandemic-driven reduced fuel demand). Some investors may eschew Energy when Information Technology is on the rise, but it has demonstrated usefulness as a diversifier of risk and return.
(Click on image to enlarge)

Historically, combining the Information Technology sector with less-correlated sectors has reduced risk and aided long-term performance. For illustration, we constructed an equal-weighted three-sector hypothetical blend of the S&P 500 Information Technology, S&P 500 Energy, and S&P 500 Consumer Staples (rebalanced monthly) and compared it with the performance of the S&P 500 Information Technology alone during the first year of the 2000 dot-com crash as well as during the YTD 2022 downturn (see Exhibit 4).
(Click on image to enlarge)

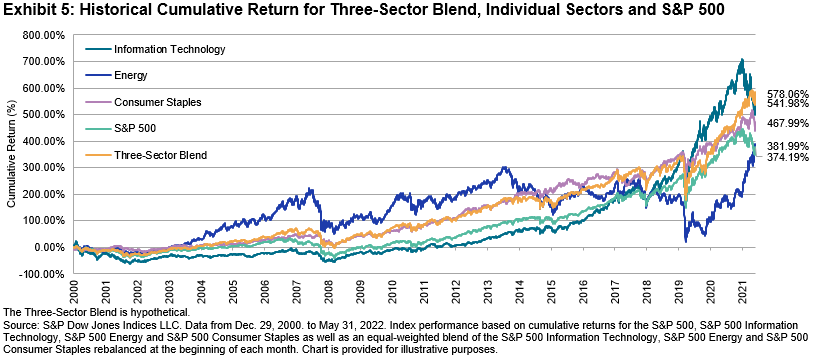
Extending the study period of the three-sector blend since 2000, we find that the combination of the three-sector blend not only exhibited similar annualized volatility (19.33%) to the S&P 500 (19.61%) but also produced higher cumulative return (578.06%) than the S&P 500 (374.19%) as well as the individual sector components thanks to diversification and regular rebalancing.
(Click on image to enlarge)
Although the path of any individual sector over time can be difficult to predict, data suggest that long-term diversification qualities among the S&P 500 sectors have been robust. If one sector bet goes wrong, others tend to go right. With 11 sectors to choose from, investors are equipped with time-tested tools to make thoughtful pairings and navigate their investing strategies through the cycle.
Disclaimer: See the full disclaimer for S&P Dow Jones Indices here.


