These 3 Airlines Look Bullish Going Into The Week: How To Play Them
The S&P 500 and the Dow Jones Industrial Average both made new all-time highs last week, but as for individual stocks it’s been a “stock picker's market.”
Due to rotation within sectors, traders and investors have watched some of the biggest ETFs soar while their portfolio of stocks sits idle. Finding specific stocks to play bullish or bearish has felt similar to finding a needle in a haystack, especially with tech pulling back from all-time highs over earnings season.
The airline sector has yet to take the stage despite a ramp-up in the vaccine rollout and customers returning to the skies for business and travel. Rotation could be set to change this, however.
Boeing Co (NYSE:BA), American Airlines Group Inc (Nasdaq:AAL) and Southwest Airlines (NYSE:LUV) look like they could be set for take-off.
The Boeing Chart
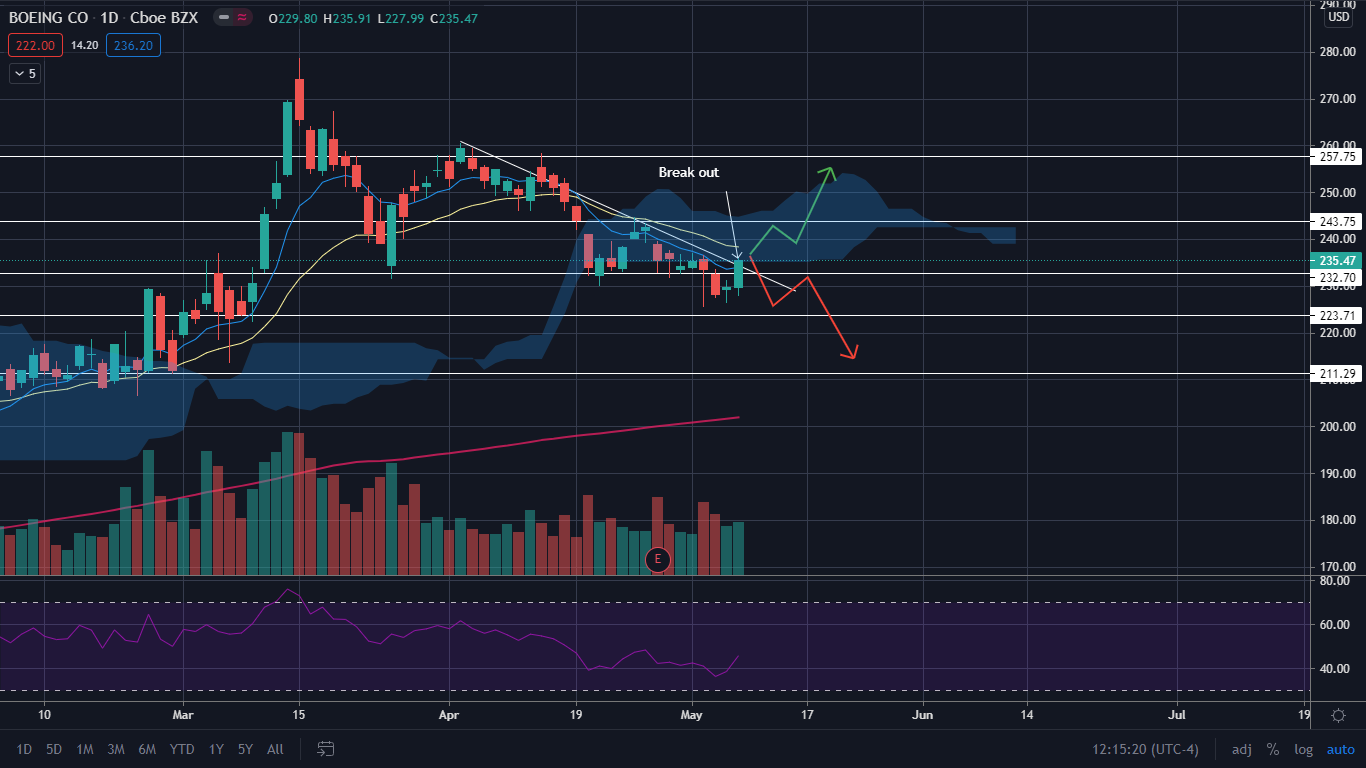
On Friday, Boeing broke up from a descending trendline that had been holding it down since April 5. Although Boeing has briefly traded above the trendline, Friday marked the first day the stock has been able to close the day above it. This will give bulls more confidence.
On Friday, Boeing also recaptured the eight-day exponential moving average (EMA) and the stock is trading above the 200-day simple moving average (SMA), which are both bullish indicators. Boeing still needs to recapture the 21-day EMA, which it could do this week if bullish volume is sustained.

Bulls want to see Boeing’s stock make a move up to its next resistance level at $243.75. Bullish volume could then pop the stock over that level which would then make it support. If Boeing can gain the $243 area as support, it has room to move back up toward the $257.75 mark.
Bears want to see Boeing's stock fall back under the descending trendline, which will cause the stock to lose support at $232.70. A loss of that level could see Boeing revisit $223.71 before finding additional support.
The American Airlines Chart
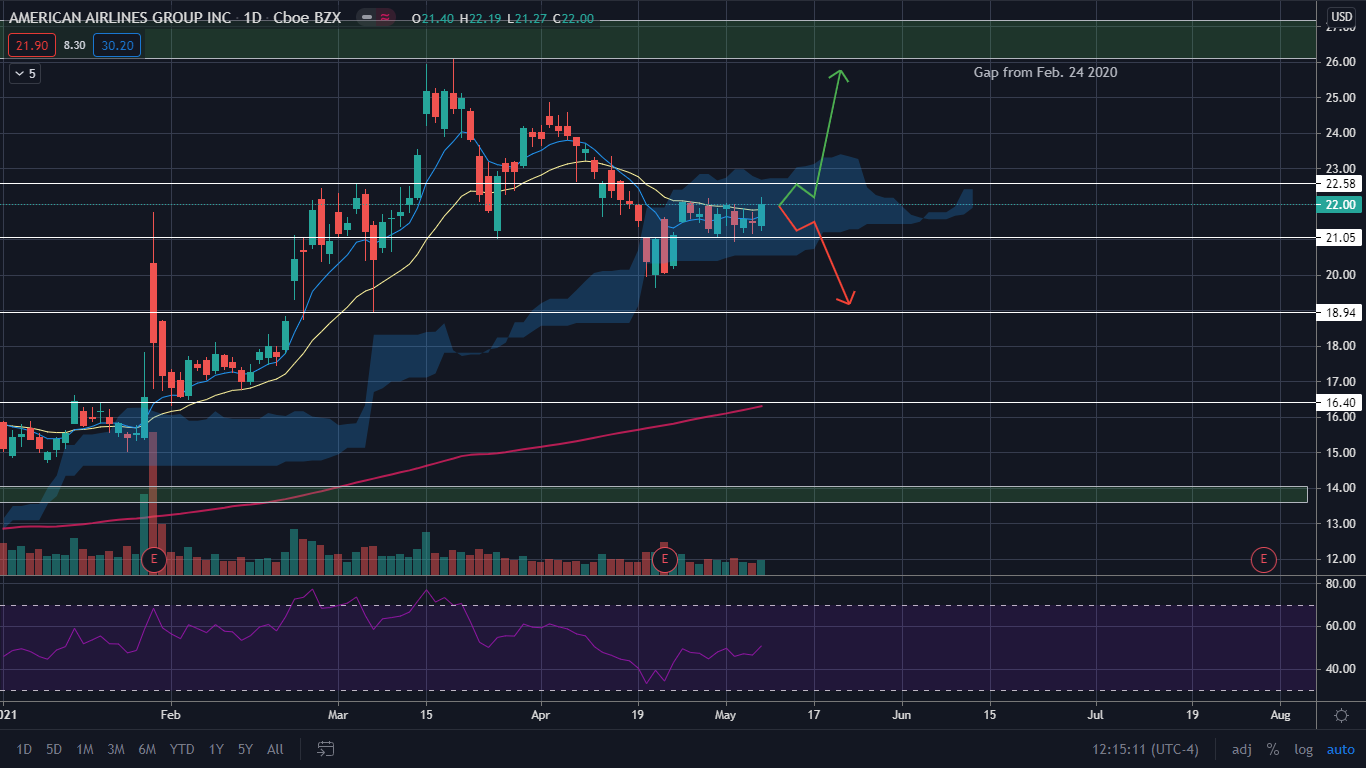
Friday, big bullish volume entered American Airlines and the stock was able to make a 2.37% move north. This helped the stock recapture the eight-day and 21-day EMAs which is bullish.
American Airlines is trading above the 200-day SMA which indicates overall sentiment in the stock is bullish.

Bulls want to see follow-through bull volume push American Airlines up over its next resistance level at $22.58. If it can regain that level as support, it has room to move up to fill the overhead gap in the $26 area. Since gaps are filled 90% of the time, it is likely American Airlines will trade back in this range in the future.
Bears want to see big bearish volume enter American Airlines’ stock and for it to drop down and lose support at the $21 area. If the stock can’t maintain the level as support, it could descend towards $18.94.
The Southwest Chart
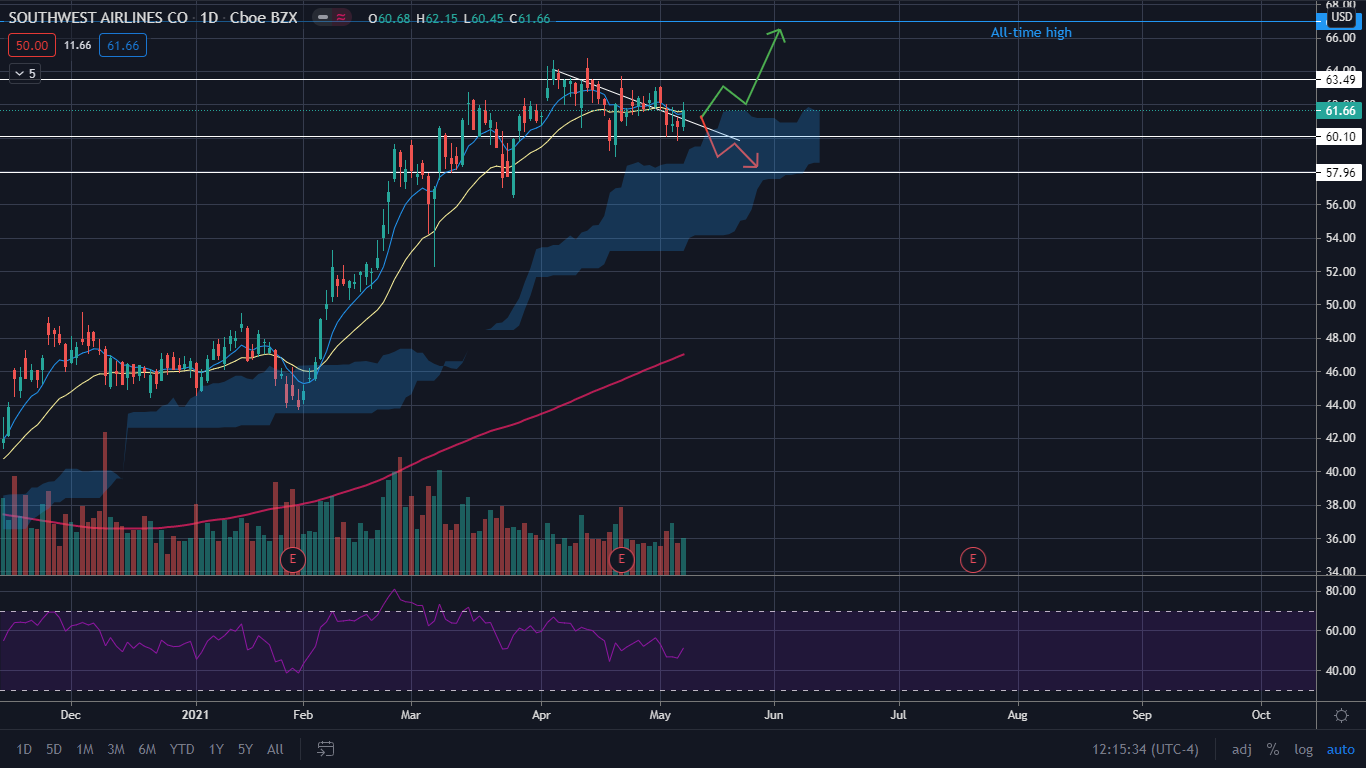
Unlike Boeing and American Airlines, which are trading down 47% and 62%, respectively, from all-time highs, Southwest is only 7% below its all-time high. Friday’s action may indicate the stock is about to take another run back towards its Dec. 21, 2017, all-time high of $66.99.
On Friday, Southwest broke up from a descending trendline that has been holding it down since April 6. The bullish break helped Southwest to regain the eight-day and 21-day EMAs, which is bullish. Like Boeing and American Airlines, Southwest is trading above the 200-day EMA which is bullish.

Bulls want to see Southwest’s stock hold over top of the descending trendline and for bullish volume to help it push up above its next resistance level near $63.50. If the stock can regain that level as support, it has room to make a run back towards all-time highs.
Bears want to see bearish volume push Southwest’s stock back under the descending trendline which would force it to lose a support level at $60.10. If Southwest trades below that level, it could retest $557.95 before potentially bouncing.
Price Action
Boeing closed Friday’s session at $235.47. Shares of American Airlines closed at $22, and Southwest’s stock closed at $61.66.


