
At the beginning of August, the stock markets suffered a collapse. In fact, August is a seasonally weak month – since 1970 it has been the second weakest in the annual cycle.
But there is an even weaker month: September.
Does this mean further trouble is imminent?
Let’s take a closer look at September from a seasonal perspective.
The stock market by month
The bar chart shows you the average performance of the S&P 500 in percent since 1970, sorted by calendar month.
S&P 500, average performance, in percent, since 1970
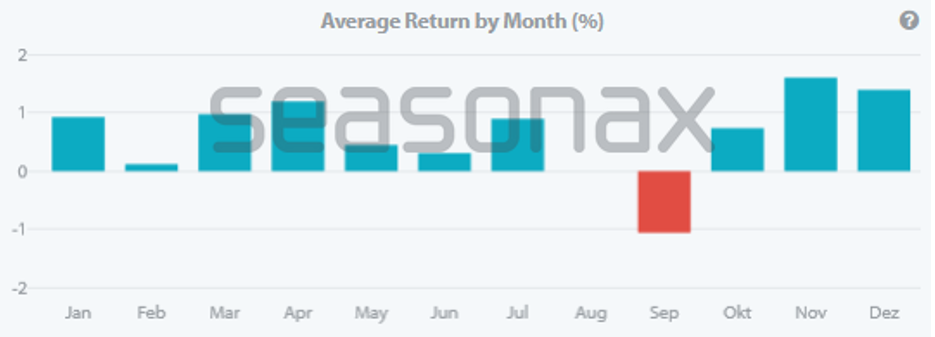
September is the weakest month. Source: Seasonax
As you can see, September stands out with a red bar. It points downwards. September is the only month that had an average loss. This was over one percent. For an average monthly return, this is quite a remarkable value.
The biggest slowdown is expected from mid-September
But how exactly does the seasonal weakness develop? Take a look at the seasonality of the US stock index S&P 500 in the day-by-day seasonal chart.
For the index, I chose the detrended seasonal trend. Detrending removes the overarching trend. The end point of the chart is at the starting point. To do this, the overarching price movement is deducted proportionally across all days.
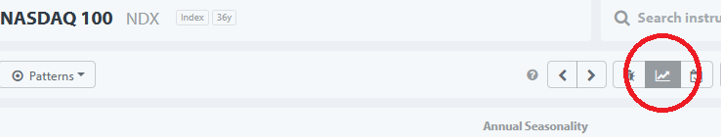
You can easily turn on detrending in Seasonax by clicking on the button with the arrow symbol above the chart:
Detrending switch in Seasonax
(Click on image to enlarge)
Detrending makes the seasonal trend more visible.
In the detrended chart, you can visually identify the seasonal trend more quickly. This makes it easier to analyze periods of weakness in instruments that have risen in the past.
The next chart shows you the detrended seasonal course of the S&P 500 on a daily basis:
S&P 500, detrender seasonal trend, determined over 55 years
(Click on image to enlarge)
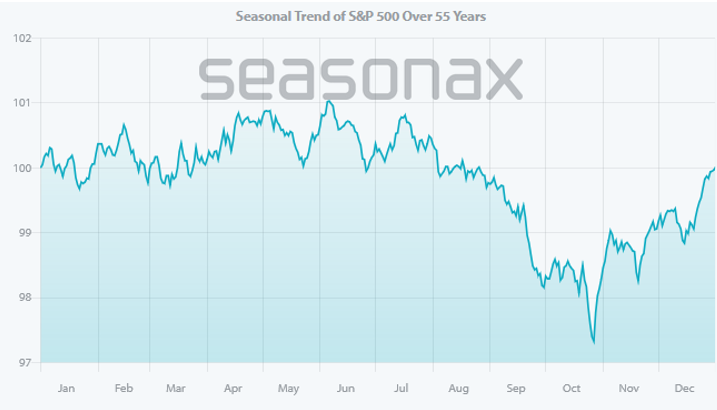
The seasonal periods of weakness are clearly visible.
As you can see, the S&P 500 falls particularly sharply from mid-September. However, the seasonal weakness tends to begin earlier in mid-July and lasts until the end of October.
The coming weeks could, therefore, be dangerous again on the stock market.
Be careful, don’t ignore the seasonal warning signs!
More By This Author:
Bailey To Buckle The FTSE 100’s Recent Run?Is Gold’s Run Coming To An End In September?
Will August See The AUDJPY Pair Fall?

Comments
Log in or sign up to join the conversation.