
The Trade Desk: Analysis Of Competition
The Trade Desk (TTD) is a technology company that empowers buyers of advertising. It operates under a thriving SaaS business model with mid double-digit growth and 30%+ operating margins, in an industry with expanding $700 million TAM. The company is the only addition to our market-beating portfolio in 2018. Readers can familiarize themselves with our original long thesis here.
In this piece, we first update our valuation model following Q4 2017 results and 2018 guidance. We then introduce and analyze the main competitors in the DSP industry, and close by reiterating our long thesis in light of the findings.
2017 results and 2018 guidance
For Q4 2017, the company reported revenues and adjusted EBITDA numbers above guidance. For Q1 2018, it guided to revenues of $73 million (+38% YoY) and adjusted EBITDA of $7.5 million (+20% YoY). And for full year 2018, to revenues of at least $403 million (+31% YoY) and adjusted EBITDA of $117 million (+23% YoY).
Implicit in the guidance is full year EBITDA margin of 29%, a 200 bsp compression relative to 2017. Most of it is due to the company investing aggressively in future growth. A smaller contribution may come from lower take rates in Connected TV. "It is land grab time in advertising", repeated CEO Jeff Green during the earnings conference call. And his actions back up his words, as evidenced by a strong hike in T&D (technology and development) expenses in Q4 2017, up 29% sequentially and 77% over the same quarter last year.
Plugging 2017 reported results into our model, we estimate full-year after-tax earnings of $82.2 million, or $1.86 per share, using 44.5 million diluted shares. We arrive at this figures after a number of adjustments, including subtracting SBC and adjusting for growth, and we believe they represent current earnings power better than both GAAP and management-adjusted figures. For detail on the adjustments, refer to our original piece on the company.
Per-share 2017 earnings power of $1.86 are 3.3% above our expectation for $1.80 coming into earnings.
With a discount rate of 8%, EPV (Earnings Power Value, or the value of current earnings if the company decided to stop investing in growth) comes at $82.8/0.08 = $1,035 million, or $23.3/share. Adding net excess cash of about $120 million brings the value of equity to $1,155 million, or $26.0/share.
Hence, EPV to equity holders represents about 50% of current stock price at $54, a similar value proposition to that available to investors when we first bought the stock in January 2017.
Analysis of competition
Most of the platforms competing with The Trade Desk belong to privately-owned businesses. This complicates the research. But with a 21st century, online approach to Philip Fisher's scuttlebutt method, it is possible to reach actionable insights.
Product
The Forrester Wave for Omnichannel Advertising DSPs published in Q2 2017 is a good place to start to get hold of the state of the DSP industry.
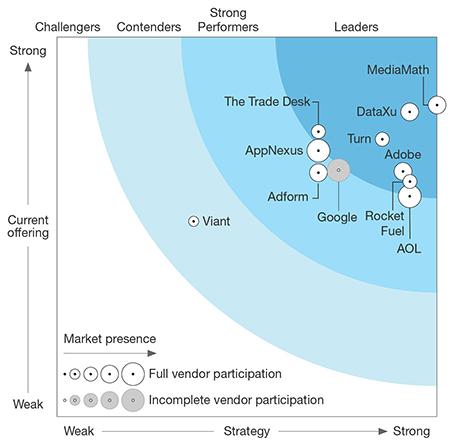
The Forrester Wave: Omnichannel Advertising Demand-Side Platforms, Q2 2017 (source: Forrester Research)
Up to five companies are listed as "Leaders", together with The Trade Desk: MediaMath, DataXu, Turn (acquired by Amobee in February 2017), Adobe (ADBE) and Rocket Fuel (acquired by Sizmek in July 2017). That two out of the six omnichannel DSP leaders were acquired in the last 13 months speaks volumes about the degree of undergoing consolidation.
Although they didn't make the cut, we note the importance of AppNexus, Google's DoubleClick Bid Manager (GOOG, GOOGL), the Amazon Advertising Platform (AMZN) and AOL's (AOL) advertising assets (Oath).
In fact, when asked about the main DSP players, industry insiders are starting to talk of The Big 4 of Google DBM, The Trade Desk, MediaMath, and DataXu, or The Big 5, including also Turn (now Amobee). AppNexus is not part of the group because it is seen as a broader ad tech platform rather than a pure DSP.
Employee satisfaction
All the companies (or company departments) mentioned above have been in existence for less than 20 years. And those standing a chance to be among the winners are growing (and hence hiring) at a breakneck pace. Therefore, we consider it very valuable to hear what company insiders have to say about the company and their CEO.
The following table summarizes company ratings from Glassdoor.
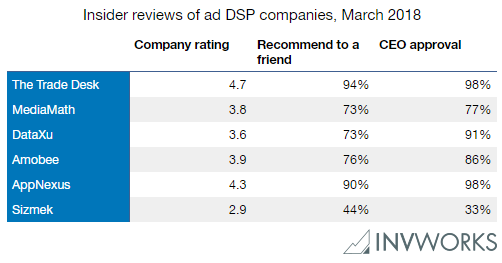
Insider reviews of the main Advertising DSPs, as of March 2018 (data from Glassdoor.com, table from Investment Works)
Search interest
Another great source of demand trends is online search interest. The figure below shows the 12-month moving average of search interest over the past 5 years, as provided by Google Trends.
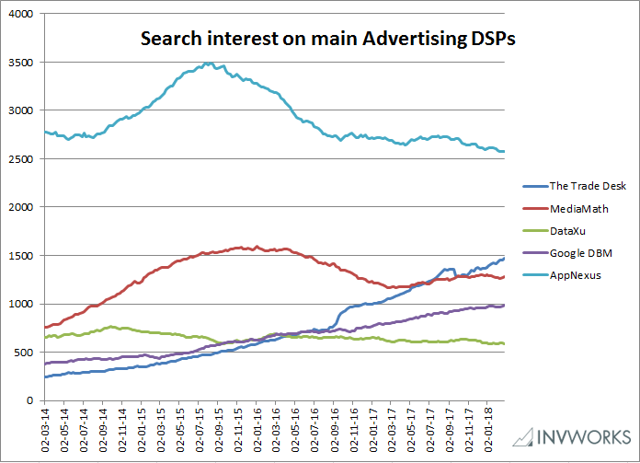
Search interest on the main Advertising DSPs, as of March 2018 (data from Google Trends, figure from Investment Works)
It is not so often that an analysis of search interest reveals such a neat trend. The Trade Desk has kept gaining search interest share from competing platforms since 2013, and if anything, the trend seems to be accelerating. Part of that spike in interest could be attributed to The Trade Desk being a publicly traded company and the growth story catching the attention of the investment community. And indeed, the spike in September 2016 corresponds to the IPO, just as the decline one year later corresponds to the interest spike around the time of the IPO falling outside of the 12-month averaging interval. But even filtering out the effect of the IPO, the line reveals an unambiguously exponential shape.
Of the remaining platforms, Google DBM seems to be also taking care. AppNexus is larger than the other independent platforms, but has been losing interest share since mid 2015.
Size and revenue growth
The Trade Desk revenues grew at 52% in 2017, which is almost twice the rate of the programmatic industry, and a much larger multiple of the digital and overall advertising industries.
That shows that The Trade Desk is grabbing not only search-interest, but also market share.
But how are the competitors faring? And how large are they?
Again, being most of them privately held companies, it is hard to come to accurate data.
According to Glassdoor, MediaMath has about 750 employees and annual revenues between $100 and $500 million.
In 2016, it was amongst America's Fastest-Growing Companies, according to Inc (so was The Trade Desk). But in 2017, it dropped from the list.
DataXu, also privately owned, has a workforce between 200 and 500 employees and revenues between $100 to $500 million.
It was in Inc.'s raking of fastest growing companies both in 2016 and 2017.
Amobee (the acquirer of Turn) is not an independent company, but a wholly owned subsidiary of SingTel (SGAPY), one of the largest telecommunications companies in the world.
AppNexus is privately held, but may be reading its IPO. It is likely to reach a valuation over $2 billion. It has over 1000 employees, didn't make it into America's fastest growing companies and is not completely media-independent, since News Corp. (NWS, NWSA) bought a stake in the company in the latest private equity raise.
Finally, Rocket Fuel (FUEL), acquired (rescued?) by Sizmek last year, has had a disastrous performance since 2014. The stock reached a markcap of almost $2 billion after IPO, but falling revenues and lack of profitability allowed Sizmek to buy the company for $122 million a few years later.
We don't comment on size and revenue of Google DBM and Amazon Advertising Platform because they are not independent DSP players.
Takeaways and future coverage
We believe that The Trade Desk comes out very strong from this analysis of competition. Although Forrester Research seems to believe that there are players with somewhat better strategy and current offerings, The Trade Desk is the clear winner in both search-interest and insider rating trends.
Its growth rate at almost 2x the broad programmatic industry is the most ambiguous evidence of the company gaining share.
Big players such as Google DBM are almost certain to do well in the future. But from the point of view of the agencies, they have conflicts of interests, since they are owners of important media assets.
Among the media-independent players, MediaMath seems to be the strongest contender. DataXu is a smaller competitor but also in for the race. And AppNexus is the only company among the competitors with a corporate culture close to The Trade Desk's.
It is also important to note that none of the omnichannel DSPs seem to have a stronger foothold in Connected TV than The Trade Desk. Adobe acquired TubeMogul last year to catch up, but the success of the integration is to be seen. And other competitors such as Videology are not omnichannel.
All in all, The Trade Desk looks like an even stronger long thesis after this piece of diligence.
Coming back to valuation: 2x Earnings Power Value is a good price for a very fine business with 20% (after-tax) normalized return on capital, 50%+ TTM growth, guidance for 30%+ next twelve-months growth, and a strong competitive position in an industry with $700 billion TAM, and expanding.
We recommend that enterprising investors use the after-earnings price pull back to initiate or add to their long positions.
Disclosure: I am/we are long TTD.
If you have enjoyed the read, Subscribe to Notifications. We will update our thesis after the Q2 ...
more


Thank's for reading. We invite you to >> FOLLOW US << on TalkMarkets and www.invworks.com/subscribe to make sure you don't miss any future research.