The Stevie Wonder, “Faith” Stock Market (And Sentiment Results)…

If you don’t have 6 and 8-year-old daughters like I do, you may not be aware that Stevie Wonder recorded a song called “Faith” (with Ariana Grande) in 2016, for the musical animated film “Sing.”The lyrics from his song that embody the sentiment of this week’s stock market (and its participants) are:
I got faith in you baby, I got faith in you now
And you’ve been such a, such a good friend of me
Know that I love you somehow
I met you, hallelujah, I got faith…
Last week we talked about a Dickensian “Tale of Two Markets”in which the consensus view was that we were getting “toppy.”However, when you looked carefully under the hood, you could see that the potential extremes were not widespread.There were a group of stocks “Dancing on the Ceiling” and a group of stocks “Dancing on the Floor.”You can find the article here: The Lionel Richie “Dancing on the Ceiling” Stock Market (and Sentiment Results)…
The question is, WHEN will the leadership rotate and Cyclicals see the light of day?
On Tuesday, I was on Yahoo! Finance with Akiko Fujita.Thanks to Sarah Smith for inviting me on. In the segment, I aim to answer the very question posed above.
I also joined Liz Claman on Fox Business this week to discuss impending changes in the Dow components. Thanks to Ellie Terrett for having me on. You can find it here.
Most Loved versus Most Hated
To build upon what we discussed last week, it’s important to take a longer-term perspective. In the chart below, I have charted the “Most Loved” stock in the S&P 500 (AAPL – Apple) versus the “Most Hated” stock in the S&P 500 (WFC – Wells Fargo):
(Click on image to enlarge)
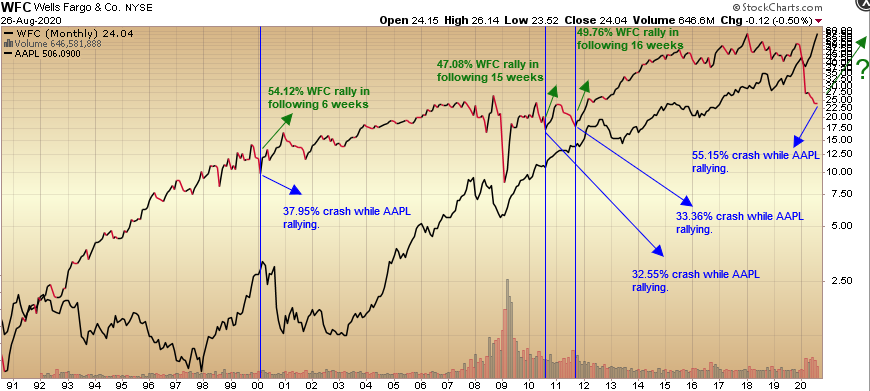
By taking a longer-term view, we can see that this unusual divergence between WFC (red and black line) and AAPL (solid black line) has only happened 4 times in the past 20 years (2020, 2011, 2010, and 2000).In all 4 instances, we had a CRASH in Wells Fargo WHILE AT THE SAME TIME Apple was RALLYING. Following the divergence, Wells Fargo recovered in record time (per the table below):
(Click on image to enlarge)

To give you some color on the divergence we are seeing today:
Over the past 2 months, the 2021 EPS Estimates for AAPL have risen 4.44% while the price of the stock has appreciated 49.70% (+76.63% ytd).
Conversely, over the past 2 months, the 2021 EPS Estimates for WFC have fallen 21.7% while the price of the stock has declined 4.4% (-52.77% ytd).
Since AAPL and WFC represent an “Apples to Oranges” comparison, I still want to point out how they are trading relative to historic metrics.
(Click on image to enlarge)
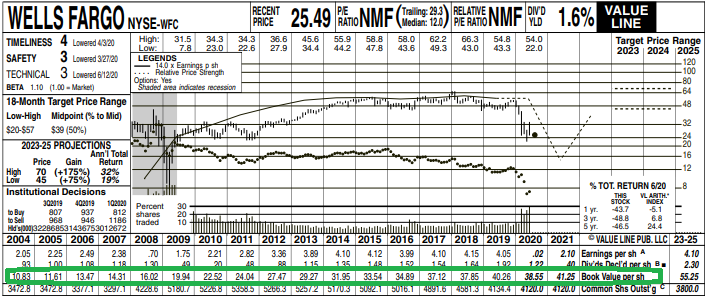
Over the past 10 years, WFC has traded between a 5.9% discount to book value (at the low end), to a 75.3% premium to book (on the high end). Right now, WFC trades at a ~37.63% discount to book.
The only other time we saw this type of discount was during the Great Financial Crisis in 2009 when it briefly traded at a 60.66% discount to book value for about a week and subsequently rebounded to 100% of book value within 2 months.
This current discount in WFC starkly contrasts to the premium (on historic metrics) that we are currently seeing in AAPL:
(Click on image to enlarge)
Tech companies are valued differently than banks. Banks generally trade at a premium/discount to book value, while Tech companies trade on a multiple to earnings (and/or expected future earnings if there are no current earnings).
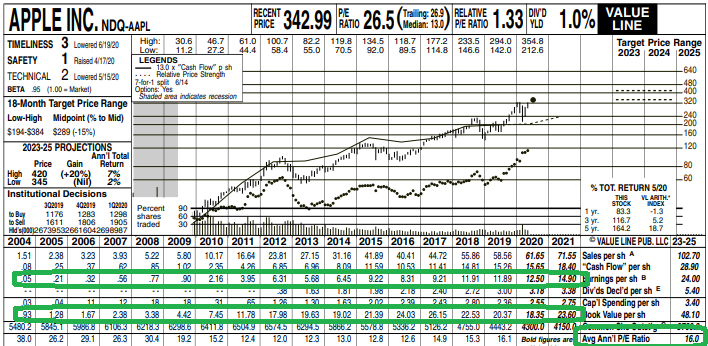
Because AAPL is an established company, it trades on Earnings power. The average current P/E multiple on earnings since 2004 has been 16x earnings. If you apply the average multiple to 2020 earnings, you get a price of $207.52. If you apply the average multiple to 2021 (forward) earnings, you get a price of $248.32. AAPL traded as high as $515 this week implying a 39.7x earnings multiple on 2020 earnings, or a 33.18x multiple on 2021 earnings. This compares to the S&P 500 trading at a ~21x multiple of 2021 consensus earnings estimates.
Over the past 10 years, the highest multiple AAPL has traded at (prior to 2020) was 24.62x (on current year EPS). We are at a multiple that is 61% higher than it has ever been (which would make sense if the earnings growth rate was going to be faster than it has ever been – but with a $2T market cap the law of large numbers makes that improbable).
If you compare that to the lowest multiple AAPL has traded at in the past 10 years (9.25x current year EPS), that would put its current price at $119.97 – a far cry from the $515 print we saw this week (39.7x earnings).
So we are at an unique time in history. If Wells Fargo was trading at its peak historic multiple of 1.75x book, you would have a $67.46 stock today.
On the flip side if AAPL was trading at its trough historic multiple of 9.25x current year earnings, you would have a $119.97.
Since neither of these full reversions is realistic in the near term, we can only think in terms of probabilities. Over time, a reversion to the mean (middle range) of respective multiples is realistic. That would imply ~1.25x book for WFC or ~$48.18 price. It would also imply 16x current year EPS for AAPL (by the time you see this reversion would be 2021 soonest) = $248.32 (this is nearly impossible to see at the moment, but would align with historic math).
So while AAPL is a spectacular company, holders at these aberrational multiples are singing Stevie’s lyrics:
I got faith in you baby, I got faith in you now
And you’ve been such a, such a good friend of me
Know that I love you somehow
I met you, hallelujah, I got faith…
I’m all for faith, but the math does not support further multiple expansion in the intermediate term. It can certainly persist in the short term, but unlikely for an extended period of time. I can’t put it any more diplomatically than that…
On the flip side, WFC may be suppressed temporarily at these levels, but over time it will revert back to the mean as it has repeatedly over decades of business cycles – and patient holders will be handsomely rewarded.
For those holding Wells Fargo at these levels, keep in mind a maxim I learned from a great mentor in my early 20’s:
“No Pressure, No Diamonds…”
Diamonds are formed because carbon is set under extreme pressure in the earth. Without pressure, it would just be carbon or maybe it would turn into graphite.
The greatest investments are made when they are extremely unpopular (but durable, high-quality long-term businesses). The pressure is great to buy what’s popular, but sooner or later the math kicks in. While it seems so obvious in the rearview mirror, it is never obvious in the middle of the race. The pressure is on and the diamonds will come. It’s just a matter of time…
In summary, to be SHORT WFC at these levels (based on historic multiples), you have to truly believe book value will be cut in half over the next year (implying a global depression). Conversely, to be LONG AAPL at these levels (based on historic multiples), you have to truly believe 2021 earnings will come in TWICE as much as consensus estimates.I would not bet on either scenario.
I can hear it now, “Wells Fargo will begin to outperform Apple on a relative basis – WHEN PIGS FLY…” That’s why I chose the featured image for this article from the movie “Sing.” It had a flying pig. Stay tuned…
Now onto the shorter term view for the General Market:
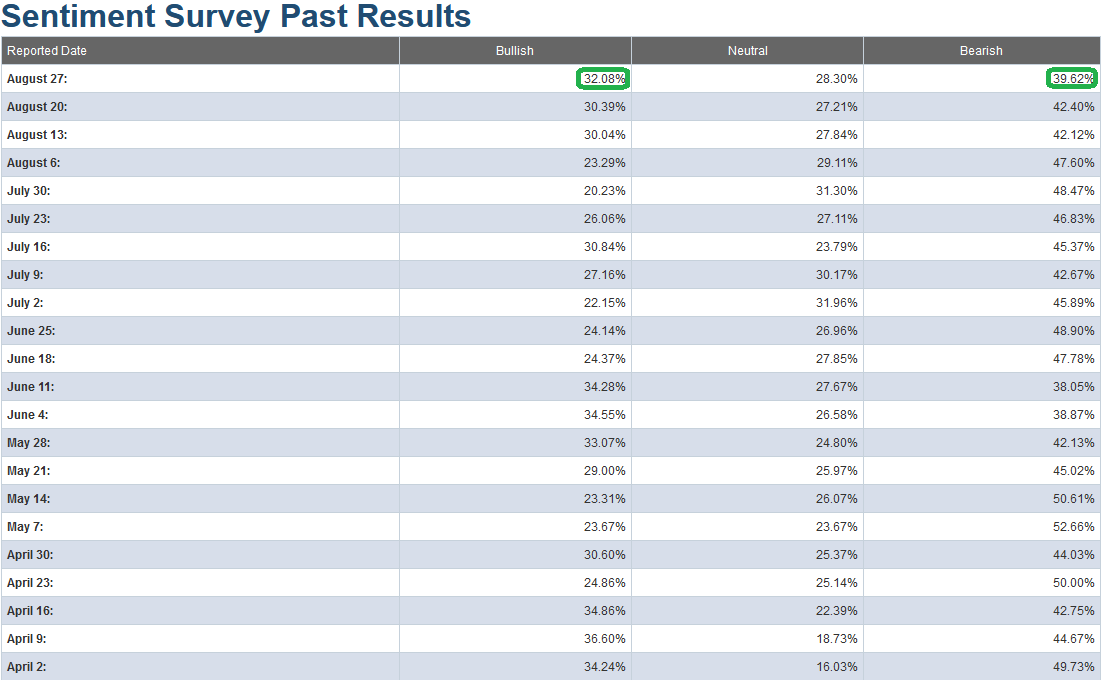
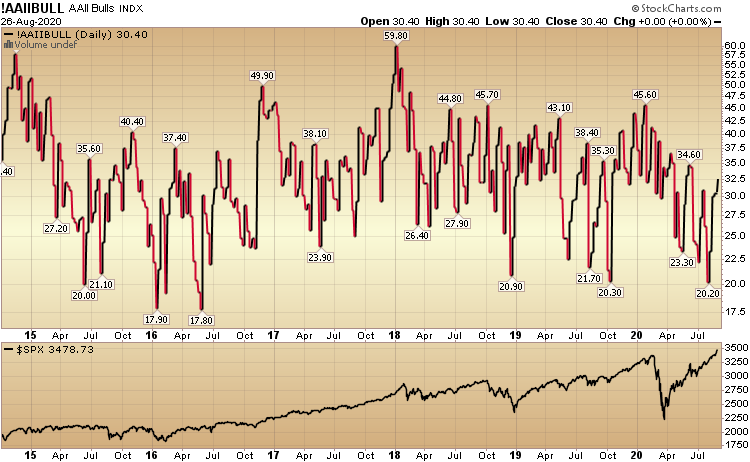
In this week’s AAII Sentiment Survey result, Bullish Percent (Video Explanation) ticked up to 32.08% from 30.39% last week. Bearish Percent moderated to 39.52% from 42.4% last week.
While a bit of optimism started to finally creep in the past few weeks, we are still not near euphoric levels. By this metric, there is room to climb the “Wall of Worry,” but that could change in coming days/weeks when euphoric levels start to return. We have not seen a “Bullish Percent” read above 40 since February.
(Click on image to enlarge)
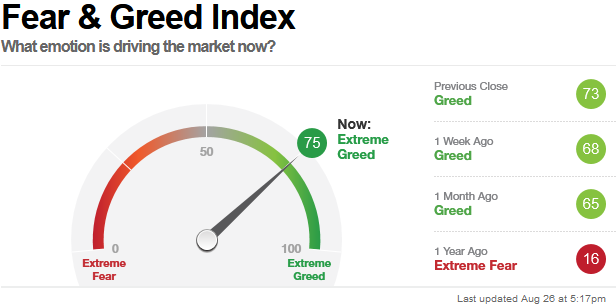
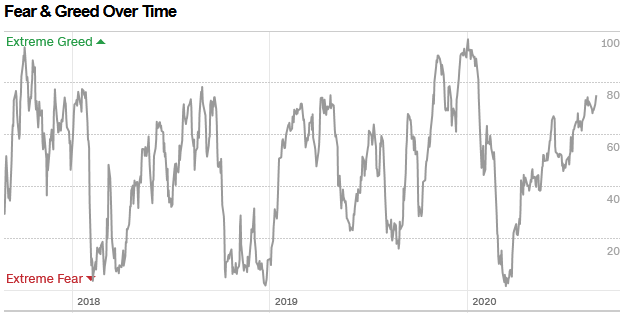
The CNN “Fear and Greed” index moved up from 68 last week to 75 this week. We are getting closer to an extreme/euphoric level (80-100), but not there yet. You can learn how this indicator is calculated and how it works here: (Video Explanation)
(Click on image to enlarge)
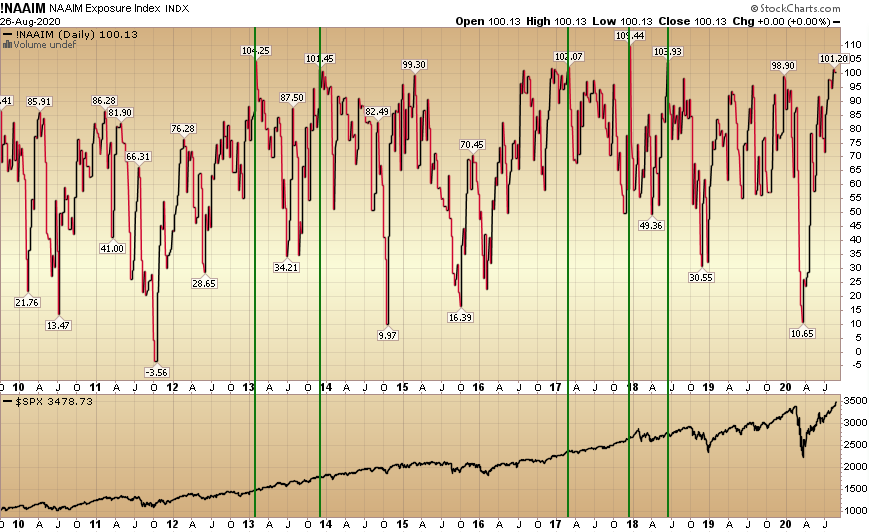
And finally, this week the NAAIM (National Association of Active Investment Managers Index) (Video Explanation) flat-lined from 101.20% equity exposure last week, to 100.13% this week. This is an extreme level, so we must be on alert to potentially trim some huge runners. That said, just because active managers are “all-in” does not mean it is the end of the trend. I have highlighted the last 5 times the reading has hit “extreme” levels (above 100). You can see that in all cases the rally persisted in even if there was a bit of short-term turbulence.
(Click on image to enlarge)
Our message for this week:
Signals are mixed. We’ve moved a long way in a short period of time. Some stocks are extended, but many sectors/stocks are trading at valuations that will prove to be attractive buys for the intermediate term. As we said last week, the catalyst for this change will likely come from science at this point. Don’t bet against science.
We remain very constructive in the intermediate term and will take advantage of any additional buying opportunities in laggard/cyclical names – should they arise over the Summer/Fall (on any pullbacks/corrections). I would not be surprised to see a bit of volatility/chop over the next few weeks.
But for now, have “Faith” – particularly in those sectors/stocks where having such faith is justified based on arithmetic, not hope…
Disclaimer: Not investment advice. For educational purposes only: Learn more at HedgeFundTips.com.


Excellent read!