
The Rocky Road Of The SPX:VIX Ratio
Well, since my last post on the SPX:VIX ratio, we find that, after true-to-form recent volatility in between 150 and below 100 to just above 90, it has, once again, spiked upward, broken and closed above 150, as shown on the following Monthly ratio chart.
The Momentum indicator has rallied and is, again, back above the zero level, which now favors the bulls on this longer term timeframe.
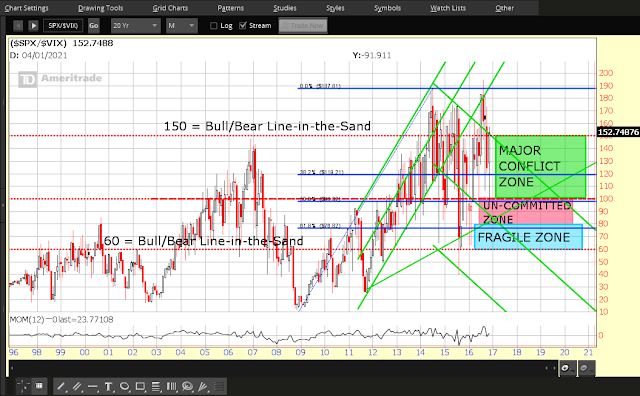
As I've said many times over the past several years, a hold above 150 clearly favors equity bulls. Watch for an SPX breakout to new all-time highs in the near term (last new high is2193.81).
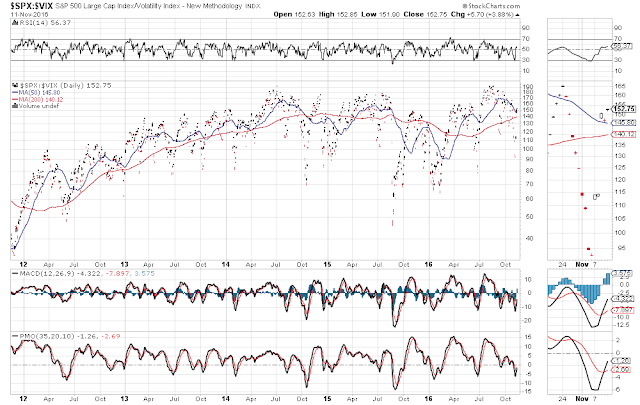
For confirmation of such a move, keep an eye on whether the MACD and PMO indicators (which have both just crossed over to the upside), as well as the RSI indicator, break their respective downtrends, as shown on the following SPX:VIX Daily ratio chart.
No doubt, markets are likely buoyed by more unity in all three U.S. Washington political houses subsequent to the Trump/Republican win last week. While traders will pay attention to the future policies, implementation, and effects of those policies, this ratio should provide a good gauge of market sentiment and momentum conviction, as well as the strength and velocity of volatility.


Thanks for sharing
Thanks for sharing