
The Real Cost Of Growth For Gold Miners - Part 2
In The Real Cost of Growth for Gold Miners – Part 1 we measured the cost of growth of eight Mid-Tier miners - B2Gold (TSX:BTO)(BTG), New Gold (TSX:NGD)(NGD), Endeavour Mining (TSX:EDV)(EXK), Oceana Gold (TSX:OGC)(OCANF), Primero Mining (TSX: P)(PPP), Newmarket Gold (TSX:NMI)(NMKTF), Teranga Gold (TSX:TGZ)(TGCDF), and Alamos Gold (TSX:AGI)(AGI).
In the second part of this series we will show how growth is reflected in the market value of the companies.
MARKET VALUE AND GROWTH
Market Value per R&R
We begin by measuring how the market values the eight companies based on Reserves and Resources in the ground. Our previous research (Real Cost of Mining Gold) showed that major mining companies are valued based on the R&R they have in the ground with a premium given to companies with a long history of successfully bringing those R&R to market.Let’s see if the same holds true for mid tier companies. We use Enterprise Value (EV= Market Capitalization + Liabilities – Current Assets) per oz R&R and EV per oz produced.
The eight companies have a relatively short production history and started producing at different times – 2013-2015 is the period that captures everyone in a comparable growth stage.
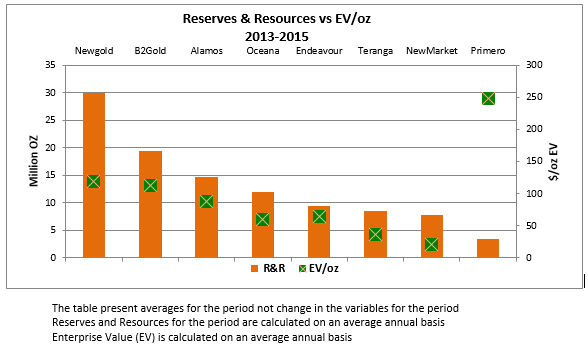
The chart shows a positive correlation between number of ounces in R&R and market value per ounce - the higher the number of R&R ounces is the higher the market value per ounce R&R is. Primero seems to be an anomaly, which we can hopefully explain with the operational health ratios further in the analysis.
Enterprise Value per oz Produced

This chart does not show the same positive correlation as the chart above, confirming that size of R&R is largely what the market responds.
Mid-tier companies need to achieve critical mass to attain higher market valuation. We know that the market values the size of R&R and growth. Now let’s see if there is a time value attached to this growth.
Market Value vs Velocity of Growth
To measure that we use what we call the speed of growth and compare it to the market value.
The speed of growth or the Average Annual Velocity of Growth is the total change in R&R since the company commenced production divided by the total number of years they have been in production.
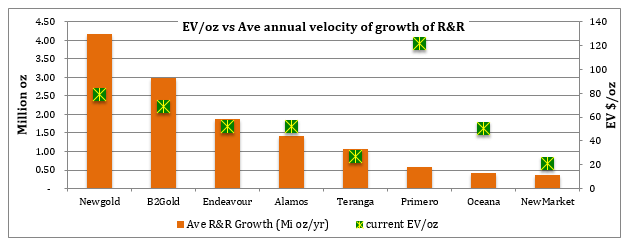
The chart shows a positive correlation (exception again is Primero) to market value and speed of growth indicating that the market does reward faster growth.
We have shown that the market values size and speed of growth higher than it values production level.
In Part 3 of The Real Cost of Growth for Gold Miners we will look into the companies’ operational efficiency and find out if it relates to a market premium or discount.
Disclaimer Cipher Research Ltd. is not a licensed broker, broker dealer, market maker, investment banker, investment advisor, analyst, or underwriter and is not affiliated with any. There is no ...
more

