The Q1 Earnings Season Kicks Off Positively

Image Source: Pexels
The market isn’t particularly impressed with what it saw in the quarterly releases from JPMorgan (JPM - Free Report), Citigroup (C - Free Report), and even Wells Fargo (WFC - Free Report). Part of the issue appears to be underwhelming guidance, particularly from JPMorgan, that most analysts saw as overly conservative.
We see the Q1 results from these three major banks as good enough; not great, but definitely not bad either. There were no major surprises from either of the three banks. In our view, the likely explanation for the market’s tentative initial reaction to these results is the stocks’ outperformance coming into this reporting cycle.
You can see this in the chart below that shows the year-to-date performance of JPMorgan, Citigroup, and Wells Fargo relative to the S&P 500 index. The chart shows the performance of these three stocks relative to the market through Thursday, April 11th, the day before the quarterly results.
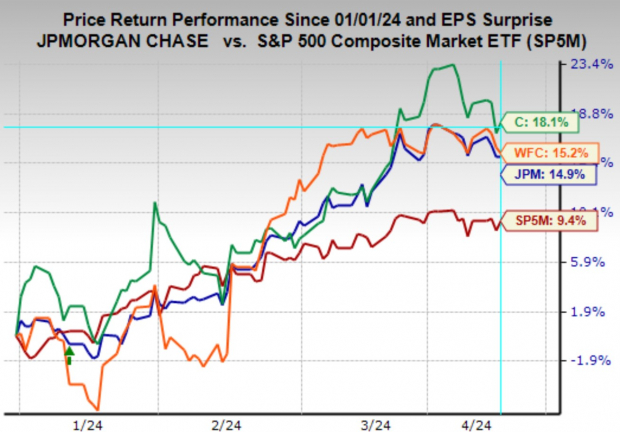
Image Source: Zacks Investment Research
The weakness in JPMorgan, Citi, and Wells Fargo shares following the banks’ Q1 results can be seen in a ‘sell-the-news’ type of framework.
JPMorgan beat on EPS but came up short on the top-line, with net income for the period up +10.7% on +11.7% higher revenues. Net interest income of $21.9 billion, excluding contribution from the First Republic acquisition, was up +4.9% from the year-earlier period, with average loan portfolios up +3% and flat deposits. Revenues in the investment banking business were up +8%, with a +27% increase in investment banking revenues partly offset by a -5% decline in markets revenues.
Wells Fargo beat on the top- and bottom-lines, with net income for the quarter down -3.1% on +4.2% higher revenues. Wells’ net interest income of $12.2 billion was down -8% from the year-earlier period, with the average loan portfolio down -2% and deposits down -1%. Wells Fargo reiterated prior full-year 2024 net-interest income guidance that is expected to be down in the -5% to -7% range from the 2023 level.
Citi beat on EPS but came up modestly short on revenues. The issue with Citi continues to be progress in management’s efforts to restructure and reposition the business. The new management team has been actively engaged in the restructuring exercise, and the market appears to be favorably looking at Citi’s new five-business-line structure. Citi’s net interest income of $13.51 billion was up +1.2% from the year-earlier level, with average loans up +4% and deposits down -3%.
Looking at the Q1 earnings season scorecard for the Finance sector, we now have results from 20.5% of the sector’s market capitalization in the S&P 500 index. Total earnings for these Finance companies are up +11.4% from the same period last year on +8% higher revenues, with a 100% EPS beats percentage and a 66.7% revenue beats percentage.

Image Source: Zacks Investment Research
Looking at the Finance sector as a whole, total Q1 earnings for the sector are expected to be up +8.1% on +3.3% higher revenues.
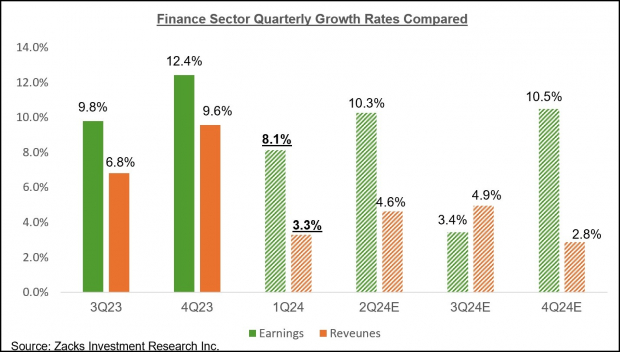
Image Source: Zacks Investment Research
Earnings Season Scorecard and This Week’s Earnings Reports
The Q1 earnings season ramps up this week, with 41 S&P 500 companies on deck to report results. In addition to a host of banks and other Finance sector companies reporting results, this week’s line-up includes several bellwethers from different sectors, such as United Health, Netflix, Johnson & Johnson, CSX Corp., Schlumberger, and others.
Through Friday, April 12th, we have seen Q1 results from 30 S&P 500 index members. Total Q1 earnings for these 30 index members are up +21% from the same period last year on +5.8% higher revenues, with 80% beating EPS estimates and 56.7% beating revenue estimates.
This is too early to draw any firm conclusions, but we nevertheless compare the earnings and revenue growth rates for these 30 index members to other recent periods.

Image Source: Zacks Investment Research
The comparison charts below put the Q1 EPS and revenue beats percentages in a historical context.

Image Source: Zacks Investment Research
At this early stage in the Q1 reporting cycle, positive surprises appear hard to come by.
The Earnings Big Picture
Looking at Q1 as a whole, total S&P 500 earnings are expected to be up +2.9% from the same period last year on +3.8% higher revenues, which would follow the +6.8% earnings growth on +4.0% revenue gains in the preceding period.
The chart below shows current earnings and revenue growth expectations for 2024 Q1 in the context of where growth has been over the preceding four quarters and what is currently expected for the following three quarters.
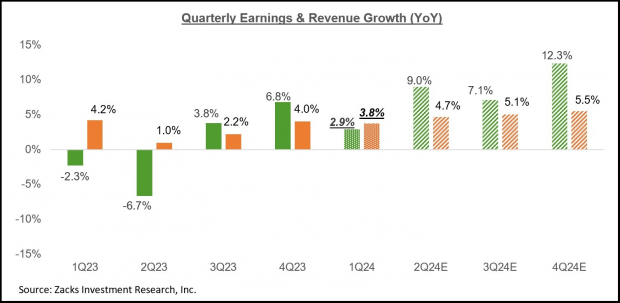
Image Source: Zacks Investment Research
As we have noted here all along, estimates for Q1 came down as the quarter got underway, though the magnitude of cuts to Q1 estimates compared favorably to what we had seen in the comparable period to the preceding quarter.
While Q1 estimates came down in the aggregate, the bulk of the negative revisions were concentrated in the Energy, Autos, Basic Materials, and Transportation sectors. On the flip side, estimates modestly increased for the Retail, Consumer Discretionary, and Tech sectors, enjoying notable positive revisions.
Embedded in current Q1 earnings and revenue estimates is a modest year-over-year decline in net margins, as the chart below shows.
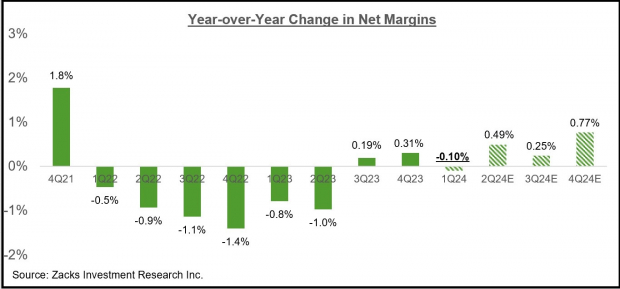
Image Source: Zacks Investment Research
This chart shows that the extreme margin pressure we witnessed in 2022 and the first half of 2023 is now behind us.
For 2024 Q1, net margins are expected to be below the year-earlier level for 9 of the 16 Zacks sectors, with the biggest declines in the Energy, Basic Materials, Autos, and Medical sectors. Net margins are expected to be above the year-earlier level for 5 of the 16 Zacks sectors, with the biggest gains at the Tech and Utilities sectors.
The Tech sector is now firmly back in growth mode, and the trend is expected to continue going forward.
For 2024 Q1, Tech sector earnings are expected to increase +19.3% from the same period last year on +8.3% higher revenues. This would follow the sector’s +27.5% higher earnings in 2023 Q4 on +8.8% higher revenues.
The sector experienced a period of post-COVID adjustment in 2022 and the first half of 2023, during which time it became a drag on the aggregate growth picture.
Please keep in mind that Tech isn’t just any other sector; it is the biggest earnings contributor to the S&P 500 index. The sector is currently expected to bring in 28.8% of the index’s total earnings over the coming four-quarter period, with the second and third biggest contributors being Finance and Medical, at 17.7% and 12.5%, respectively.
This means that the Tech sector’s growth profile has a very big impact on the aggregate picture, both negatively and positively.
The Tech sector dragged down the aggregate growth picture in 2022 and the first half of 2023 and now appears ready to resume its historically positive growth role.
You can see this growth profile in the chart below, which also shows that the sector’s 2023 Q4 earnings tally of $158.5 billion was a new all-time quarterly record.
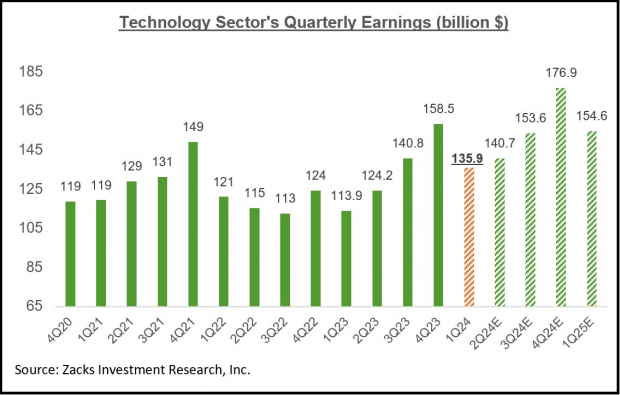
Image Source: Zacks Investment Research
Please note that the Tech sector is instrumental in keeping the aggregate growth picture in positive territory in Q1. Excluding the sector’s substantial contribution, Q1 earnings for the rest of the index would be down -2.4% from the same period last year (vs. +2.9% as a whole).
Looking at the overall earnings picture on an annual basis, total 2024 S&P 500 earnings are expected to be up +8.4% on +1.9% revenue growth.
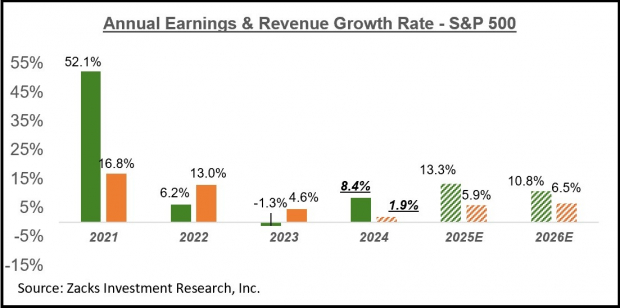
Image Source: Zacks Investment Research
More By This Author:
Top Research Reports For ServiceNow, Progressive & Analog Devices
The 2024 Q1 Earnings Season Gets Underway
Top Research Reports For SAP, Verizon Communications & Lowe's


