

JPMorgan Chase & Co. (JPM) is an American multinational investment bank and financial services holding company headquartered in New York City and incorporated in Delaware. As of December 31, 2021, JPMorgan Chase is the largest bank in the United States, the world's largest bank by market capitalization, and the fifth-largest bank in the world in terms of total assets, with total assets totaling to US$3.831 trillion.
JPM Daily Chart June 2023
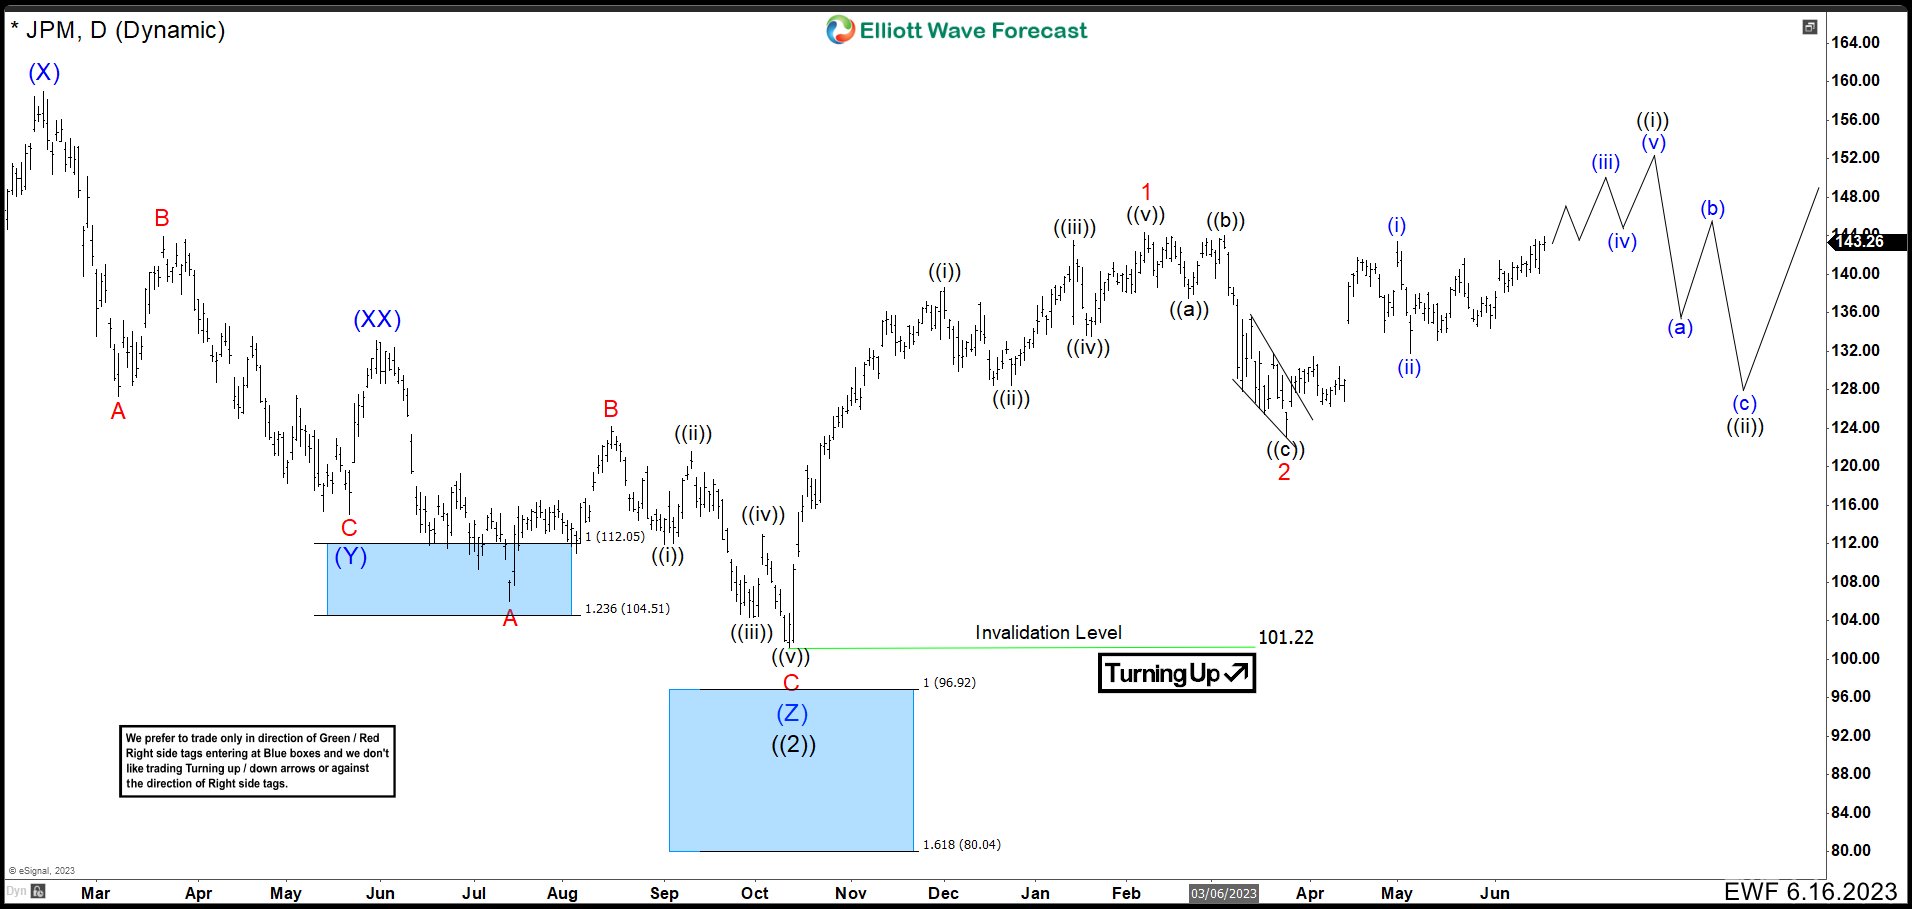
In June 2023 update, we showed a cycle ended as wave ((2)) near to a blue box at 101.22. Then, we can see how price action built 5 waves higher to end the leading diagonal at $144.34 as wave 1. Then, it developed a flat correction 3-3-5 where wave ((c)) was a clear ending diagonal to finish wave 2 at $123.11 low. After this, the market continued to the upside and we called that the stock should continue with this trend until completing another impulse as wave ((i)) before seeing 3, 7 or 11 swings correction as wave ((ii)). If you want to learn more about Elliott Wave Theory, please follow these links: Elliott Wave Education and Elliott Wave Theory).
JPM Daily Chart October 2023
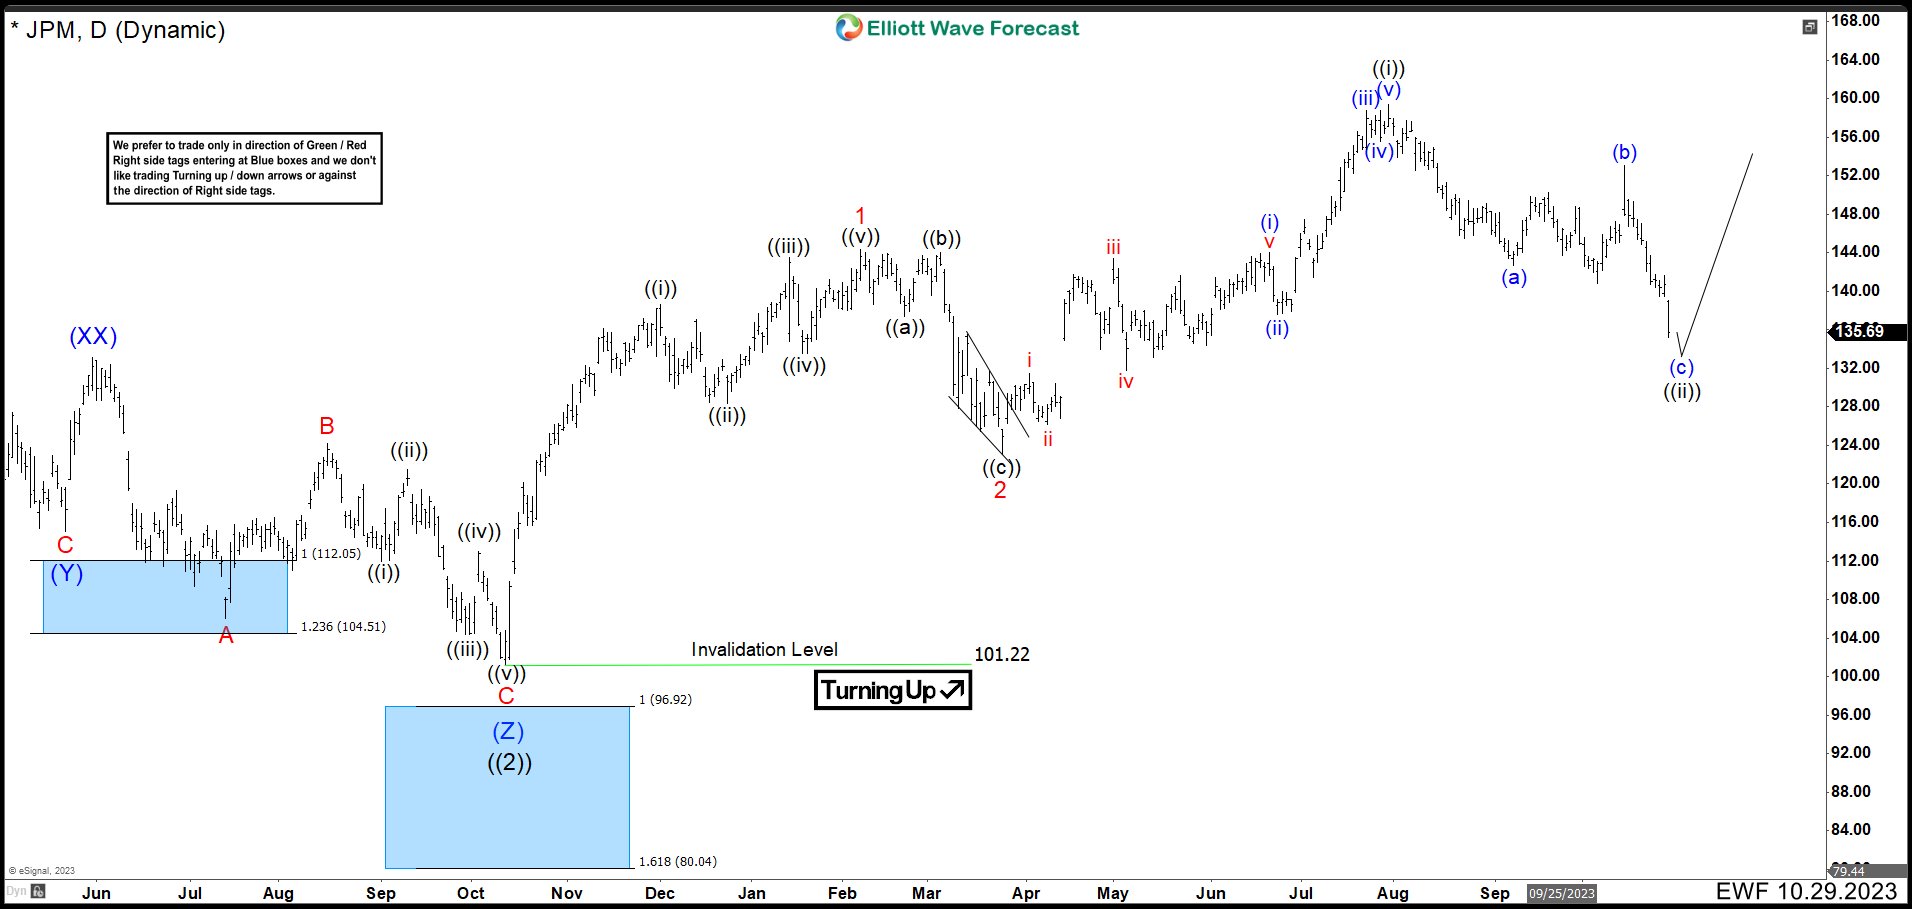
In October 2023, the market continued higher as expected and it ended wave ((i)) at $159.38 high. Then, the price action developed clearly 3 swings lower where wave (b) was a flat correction and it should keep dropping to $134.59 - $130.20 area to end wave ((ii)) before turning higher again.
JPM Daily Chart February 2024
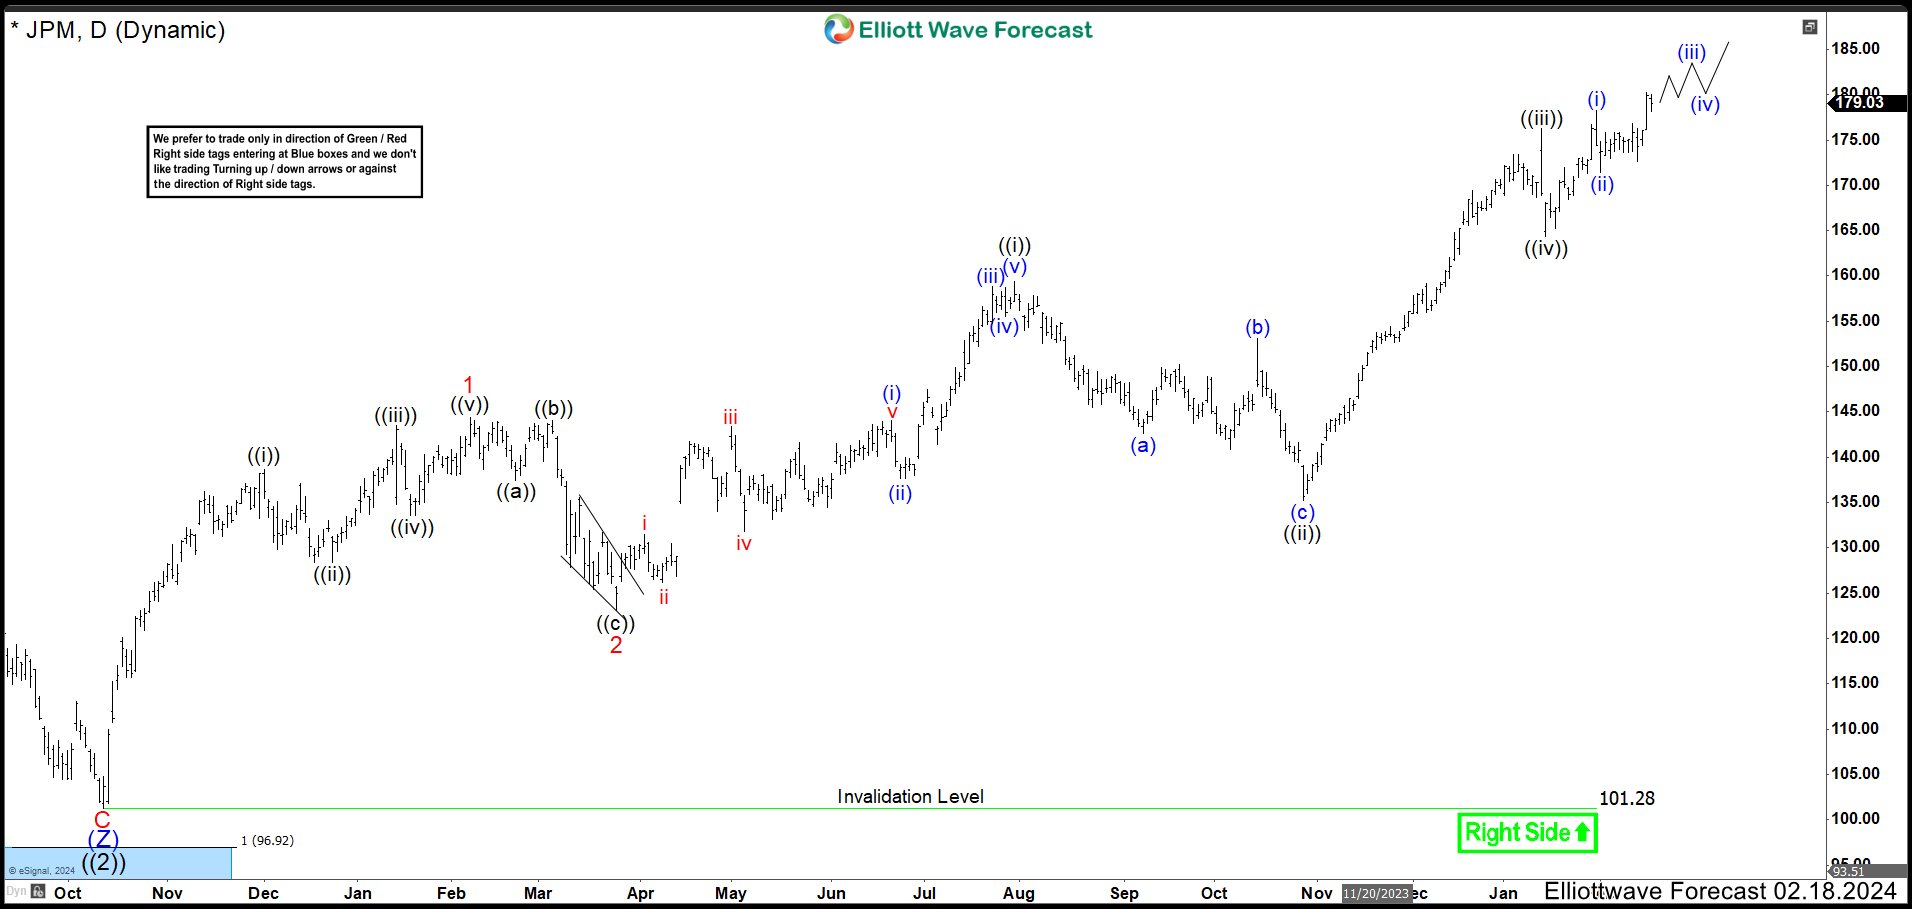
In February, the wave ((ii)) ended at $135.19 low missing the minimum target of $134.59 for 60 cents. JPM rallied strong continuing with the impulse structure. Wave ((iii)) completed at $176.31 high and pullback as wave ((iv)) ended at $164.30 low. We were looking for more upside to complete wave ((v)). This wave ((v)) also would end wave 3 and the stock should enter in a wave 4 correction.
JPM Daily Chart June 2024
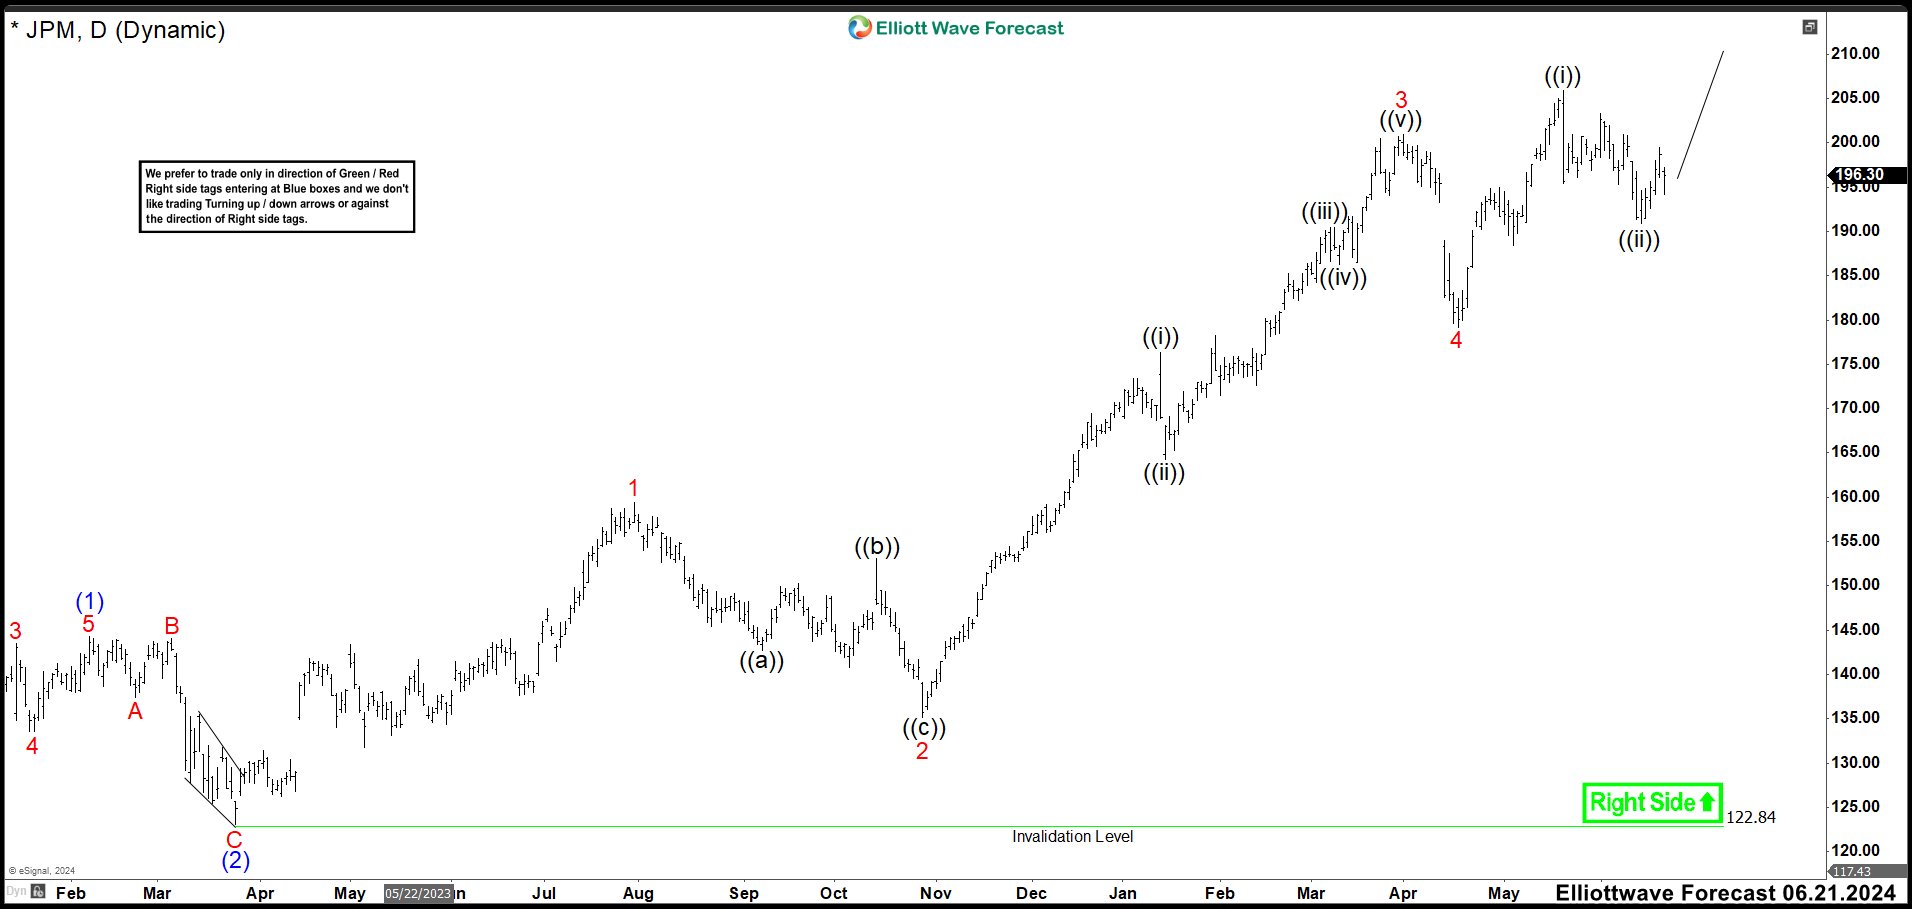
More than a year ago, we have seen how JPMorgan shares have doubled in value from 100 to 200 dollars. Here in the daily chart, we have adjusted the labels creating a triple nest. Therefore, what we used to call waves 1-2 are now (1)-(2). Waves ((i))-((ii)) are 1-2. And what we called wave ((iii)), we labeled as wave ((i)) of the extension of wave 3. Shares ended wave ((v)) of 3 at $200.94 high and started wave 4 corrrection finishing at $179.20 low. Market continued with the rally ending a new high at $205.88. This peak we are calling as wave ((i)) of 5 of (3). Wave ((ii)) of 5 ended at $190.88 low and JPM needs to break above wave ((i)) to confirm that wave ((iii)) has started. Inclusive, wave 5 of (3) could have completed already. To get that conclusion, the market must fall below $186 and test prices at $180.
JPM Weekly Chart June 2024
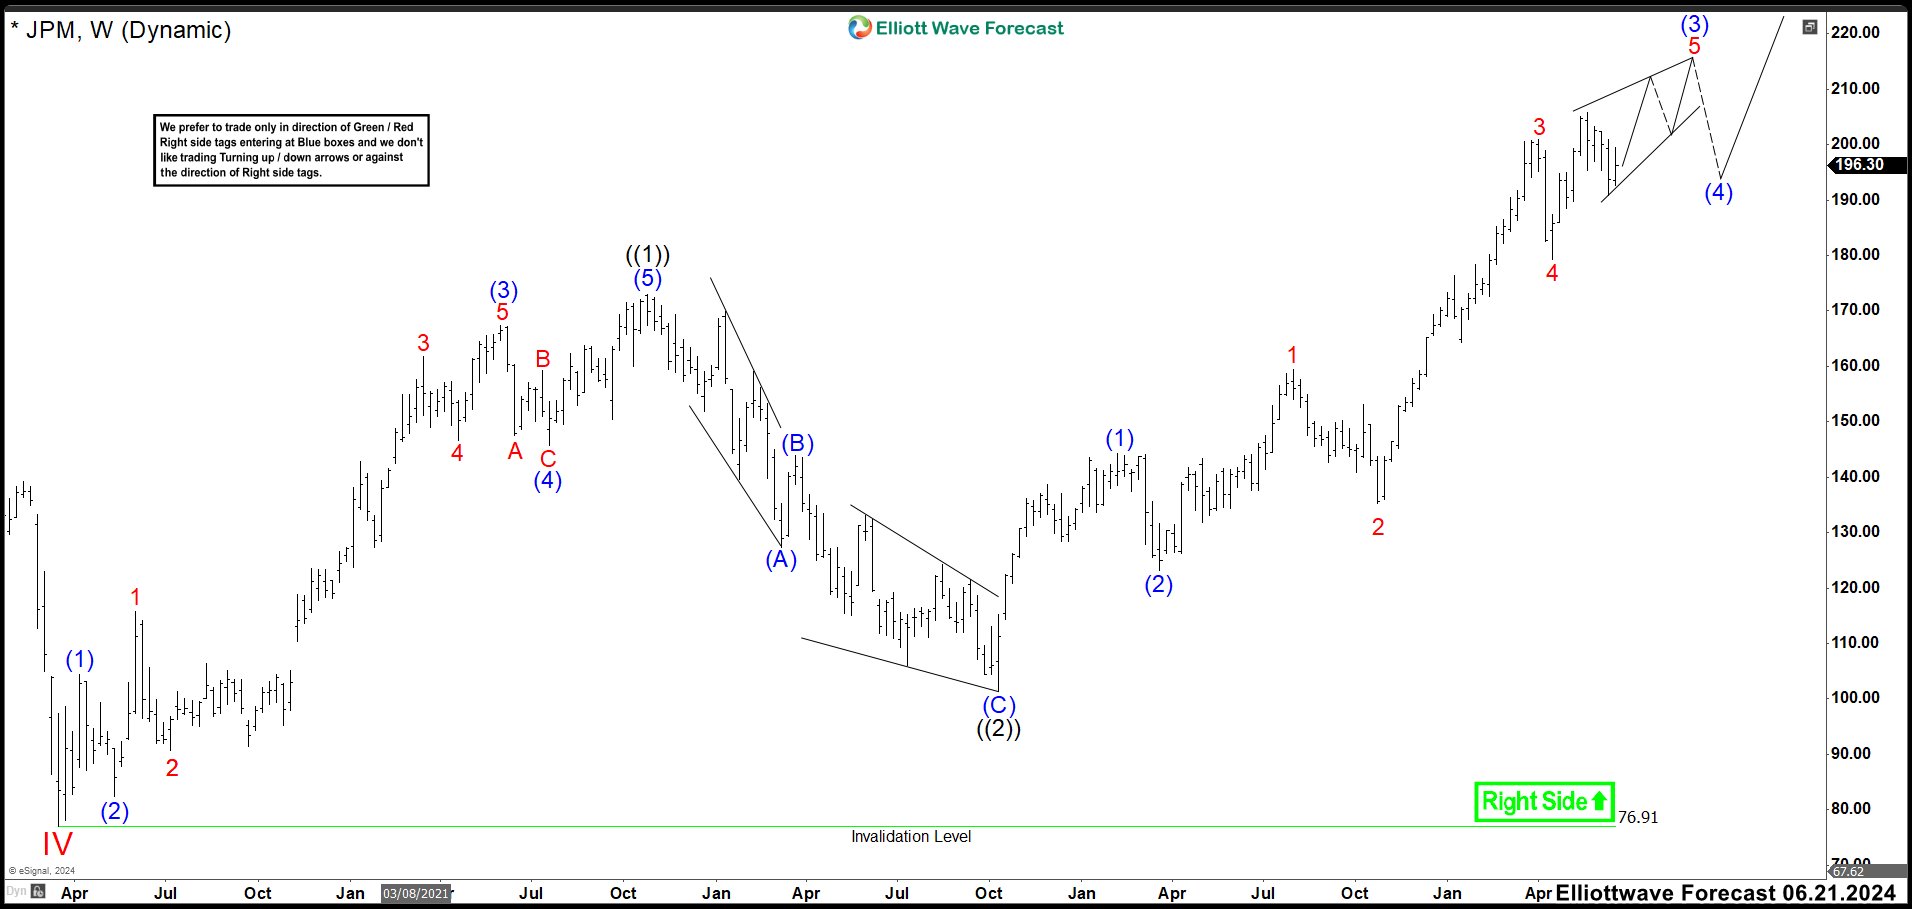
This is the weekly chart with which we can see the picture more clearly. Currently, the stock is building wave ((3)) of V. Wave ((1)) ended at $172.96 high and wave ((2)) ended at 101.28 low. Therefore, JPM prices must continue to rise to develop wave ((5)) of V. The strategy is simple. You have to look for buying opportunities after 3, 7 or 11 swings correction until wave V is ended.
More By This Author:
Incomplete Bullish Elliott Wave Sequence In Netflix Argues For More Upside
Elliott Wave Analysis On Nasdaq Looking For Further Rally
Elliott Wave Analysis On Copper Expects The Metal Turning Higher


Comments
Log in or sign up to join the conversation.