
The Market Must Not Be Watching The News
In our previous May 22nd Stock Market Update & Asbury Investment Management Video, we pointed out that the S&P 500 (SPX) was at a major inflection point, testing major overhead resistance at its 200-day moving average. We said to watch volatility for a leading indication of the benchmark index’s direction from there.
Keep Watching The VIX
Chart 1 below, an updated version of the one shown in that May 22nd report, plots SPX daily since March in the upper panel (black bars) with a corresponding chart of the CBOE Volatility Index (blue bars) — better known as the VIX or the Fear Gauge — and its 21-day moving average (red line) in the lower panel. We use the 21-day MA to identify the VIX’s monthly (our Tactical time period) trend.
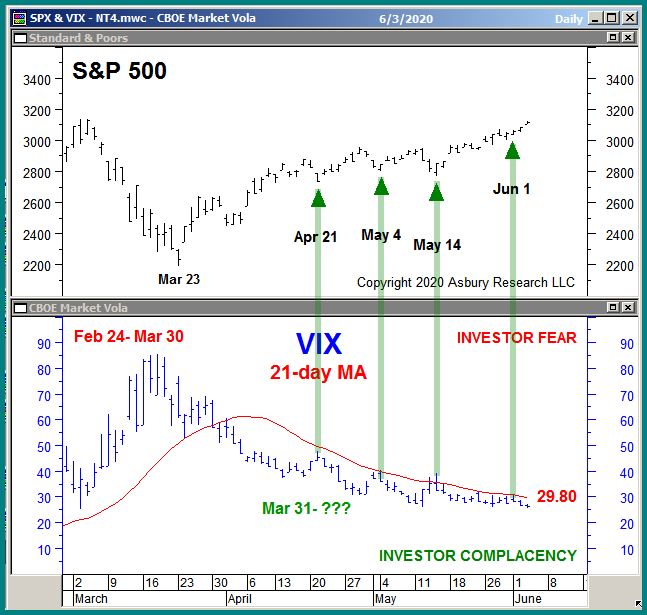
Chart 1
The green highlights show that the VIX has been below its 21-day MA since March 31st and that this has closely coincided with the current late March rally in the S&P 500. The red highlights on the left side show that the sustained rise in the VIX, above its 21-day MA between Feb 19th and Mar 30th, closely coincided with SPX’s sharp collapse during that period. This shows as volatility decreases, the market gains confidence. Moreover, the green arrows show that, since March 31st, each time the VIX tested and held its 21-day MA from below coincided with a near term bottom in SPX.
As long as the VIX remains below its 21-day MA, this improbable stock market rally — amid a global pandemic, 40 million people unemployed, a slew of corporate bankruptcies, and rioting in the streets — is likely to continue.
The S&P 500: Where To Next?
Chart 2 below plots SPX daily since July 2019 and highlights the key index levels above (overhead resistance) and below (underlying support) the market. It shows that the index has been trading above its 200-day moving average (orange line), currently at 3005, for about a week. This suggests the major trend is turning back to positive or bullish, and that — bigger picture — the 2009 secular uptrend (blue dashed line) is resuming.

Chart 2
The red dashed lines show that the next two potential stopping points above the market are at 3137 and 3215, which are about 1% and 4% above the market. As long as the VIX continues to decline on a monthly basis, it is likely that these levels will be tested later this month. A spike in the VIX, however, would indicate the market is getting nervous — and that’s when we should be getting defensive.
Disclosure: None.


