
I often write about seasonality and seasonal trends. I view them as tailwinds or headwinds, but definitely not something to trigger action. I also know that when the media highlights a seasonal pattern it becomes very unlikely to play out. I also know that most people quote seasonality without ever doing the research to confirm what they are saying. It’s also what I write about a lot, laziness.
The month of September is here. I have heard from a number of folks warning me that it’s the worst month of the year and I should take action. Someone actually told me that I should sell everything until October begins. Well folks, here are some facts, not narratives. On average the month of September yields a -1% return. On the surface that doesn’t seem so terribly awful for the worst month of the year.
Upon closer inspection the -1% return is not linear. Here is what we know from data. More than 100% of the -1% return comes from just five days in September in what has been deemed the weakest week of the weakest month. So for all the warnings, gloom and doom and scariness, September boils down to five bad days later in the month.
Furthermore, when September begins in an uptrend like it just did, the average return was +0.30% versus -2.7% when the month begins in a downtrend. We also know that when the stock market has rallied into Labor Day, the following week tend to give back some of those gains. Pivoting to presidential patterns, assuming Donald Trump is viewed as a second term president, stocks actually rally over the final four months of the year versus a summer peak and decline into next summer for a first term president.
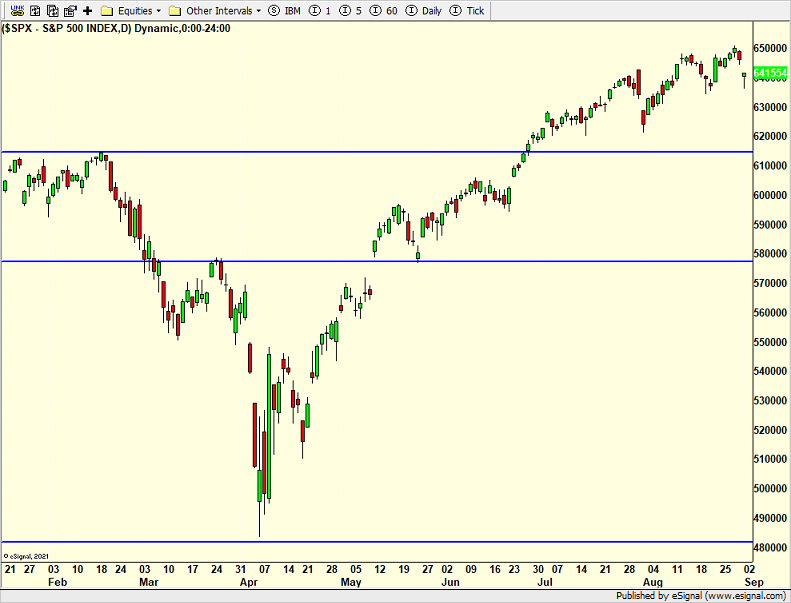
Stocks declined to begin the month, Sharper early losses were mitigated during the afternoon. The S&P 500 is first. Hardly worrisome so far.
(Click on image to enlarge)
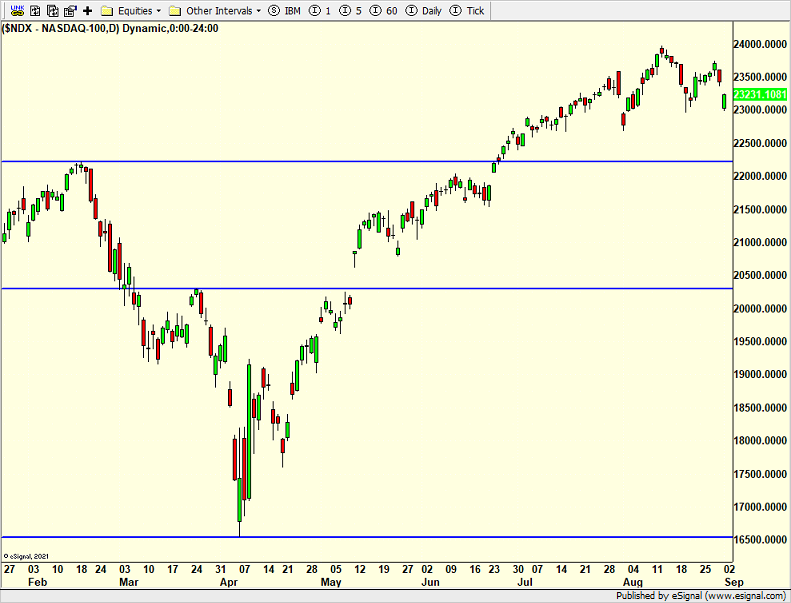
The NASDAQ 100 where all those AI stocks reside looks weaker than the other indices, but not weak in absolute terms.
(Click on image to enlarge)
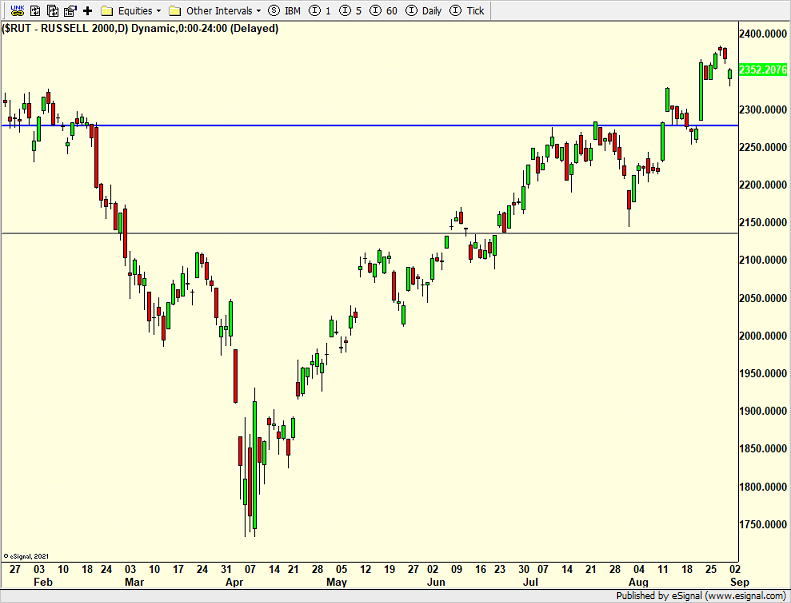
The Russell 2000 Index of small caps which I have written about a number of times since April continues to look favorable.
(Click on image to enlarge)
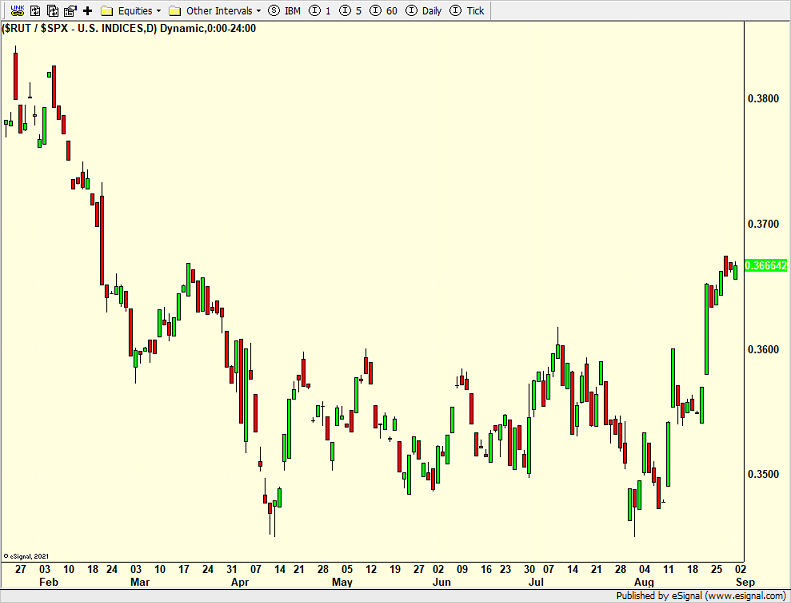
On a relative basis, the Russell’s outperformance and leadership continues to play out as I have described. I just don’t have high conviction whether this will be a multi-quarter trend or more short-lived. In both cases we continue to play this trend until proven otherwise.
(Click on image to enlarge)
On Friday we bought SPYQ, AGG, SEPT, more XLF, more XBI, more XHB, more PCY, more EMB, TAN, more IGV, more XLRE and more XLC. We sold SSO, some UWM, some MQQQ and some HYG. On Tuesday we bought QLD, KSEP and more HYG. We sold AGG, some PCY and some EMB.
More By This Author:
iShares Silver Trust: Chart Analysis
How To Approach September Trading
Iren Ltd Chart Analysis


Comments
Log in or sign up to join the conversation.