
The Hidden Price Pattern That Could Decide If We Crash To 6,000 Or Hit New Highs

Image Source: Unsplash
Find out what Friday’s price action really means for traders and where the S&P 500 is heading to.
Watch the video from the WLGC session on 12 Aug 2025 to find out the following:
- What exactly does a ‘change of character’ mean in market analysis, and why does it matter now?
- Which key price levels could decide whether we rally to all-time highs or plunge to 6,000?
- What historical patterns or analogs suggest the next big move in this market?
- And a lot more…
Video Length: 00:02:57
Market Environment
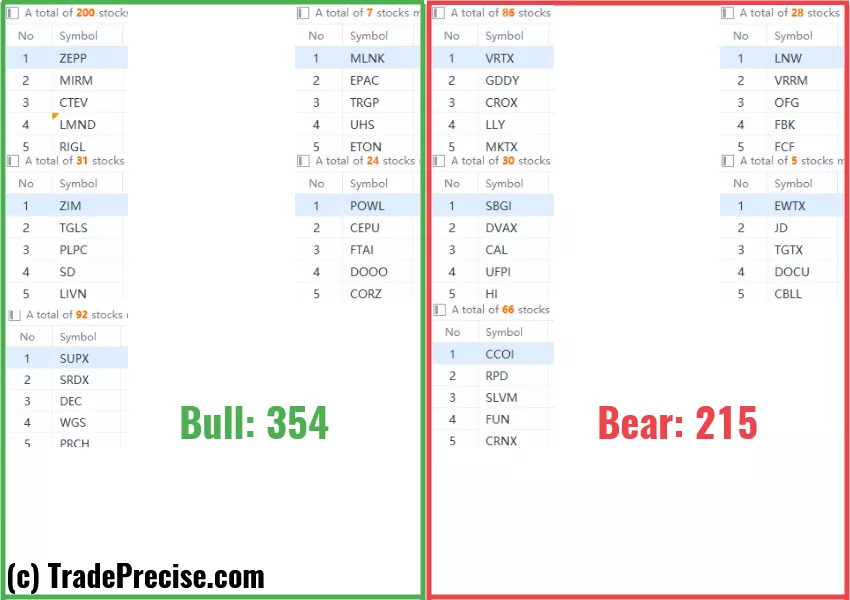
The bullish vs. bearish setup is 354 to 215 from the screenshot of my stock screener below.
(Click on image to enlarge)
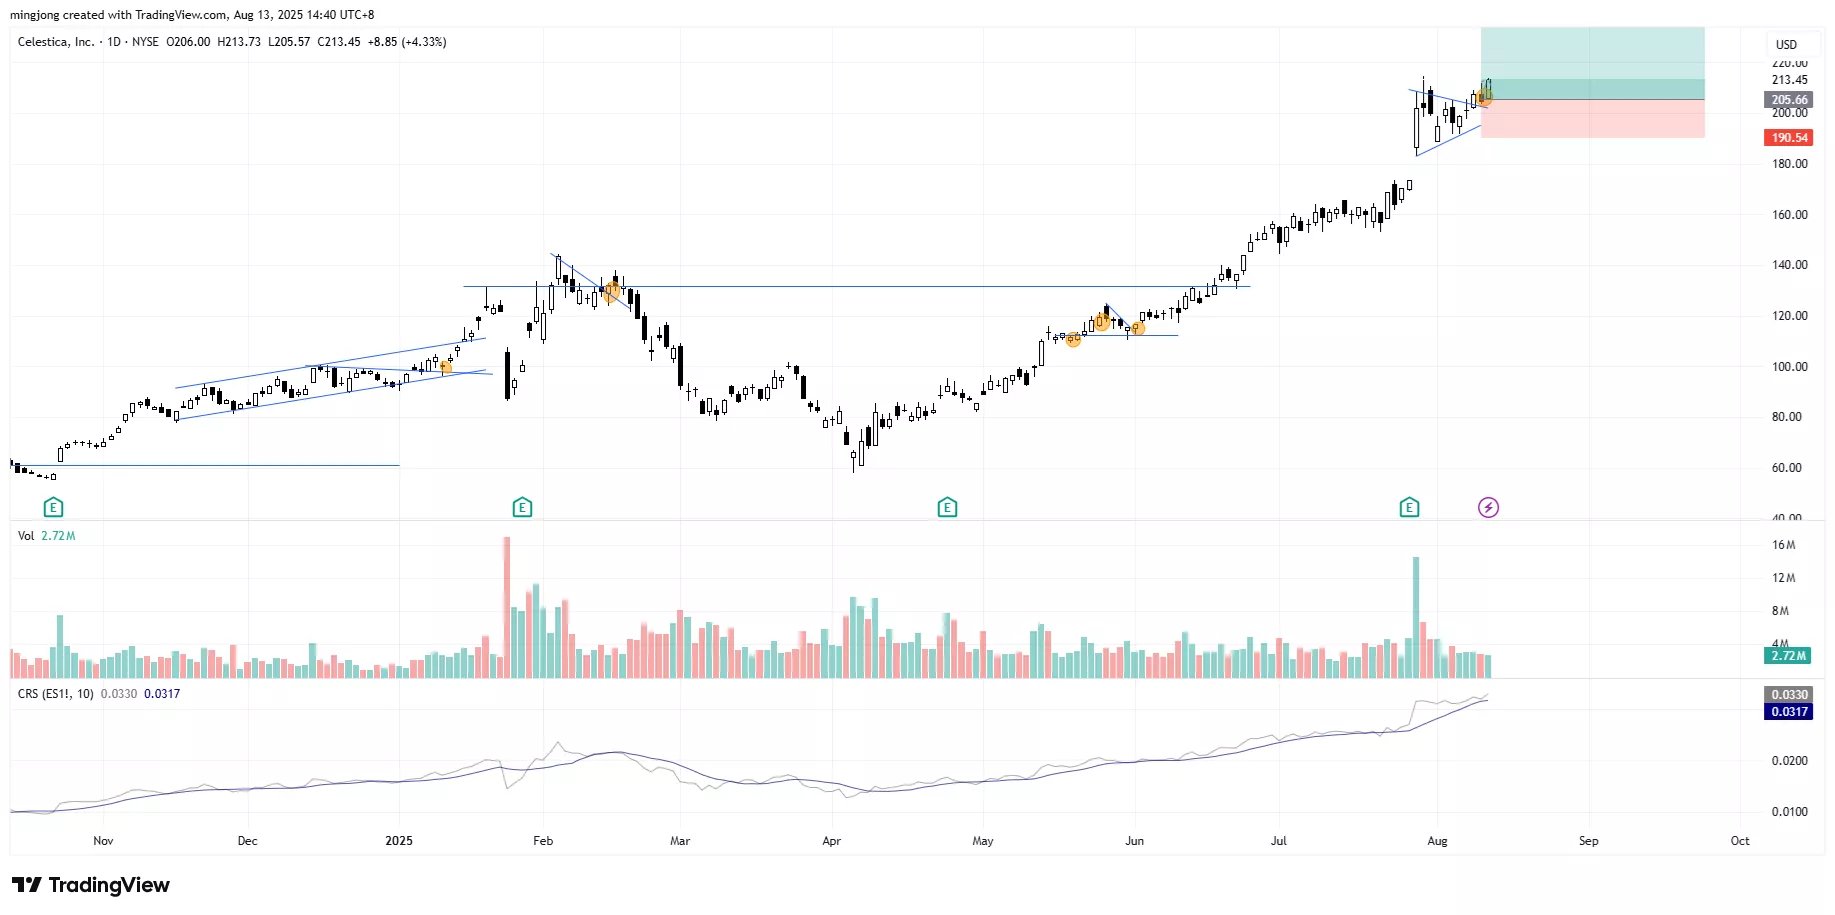
3 Stocks Ready To Soar
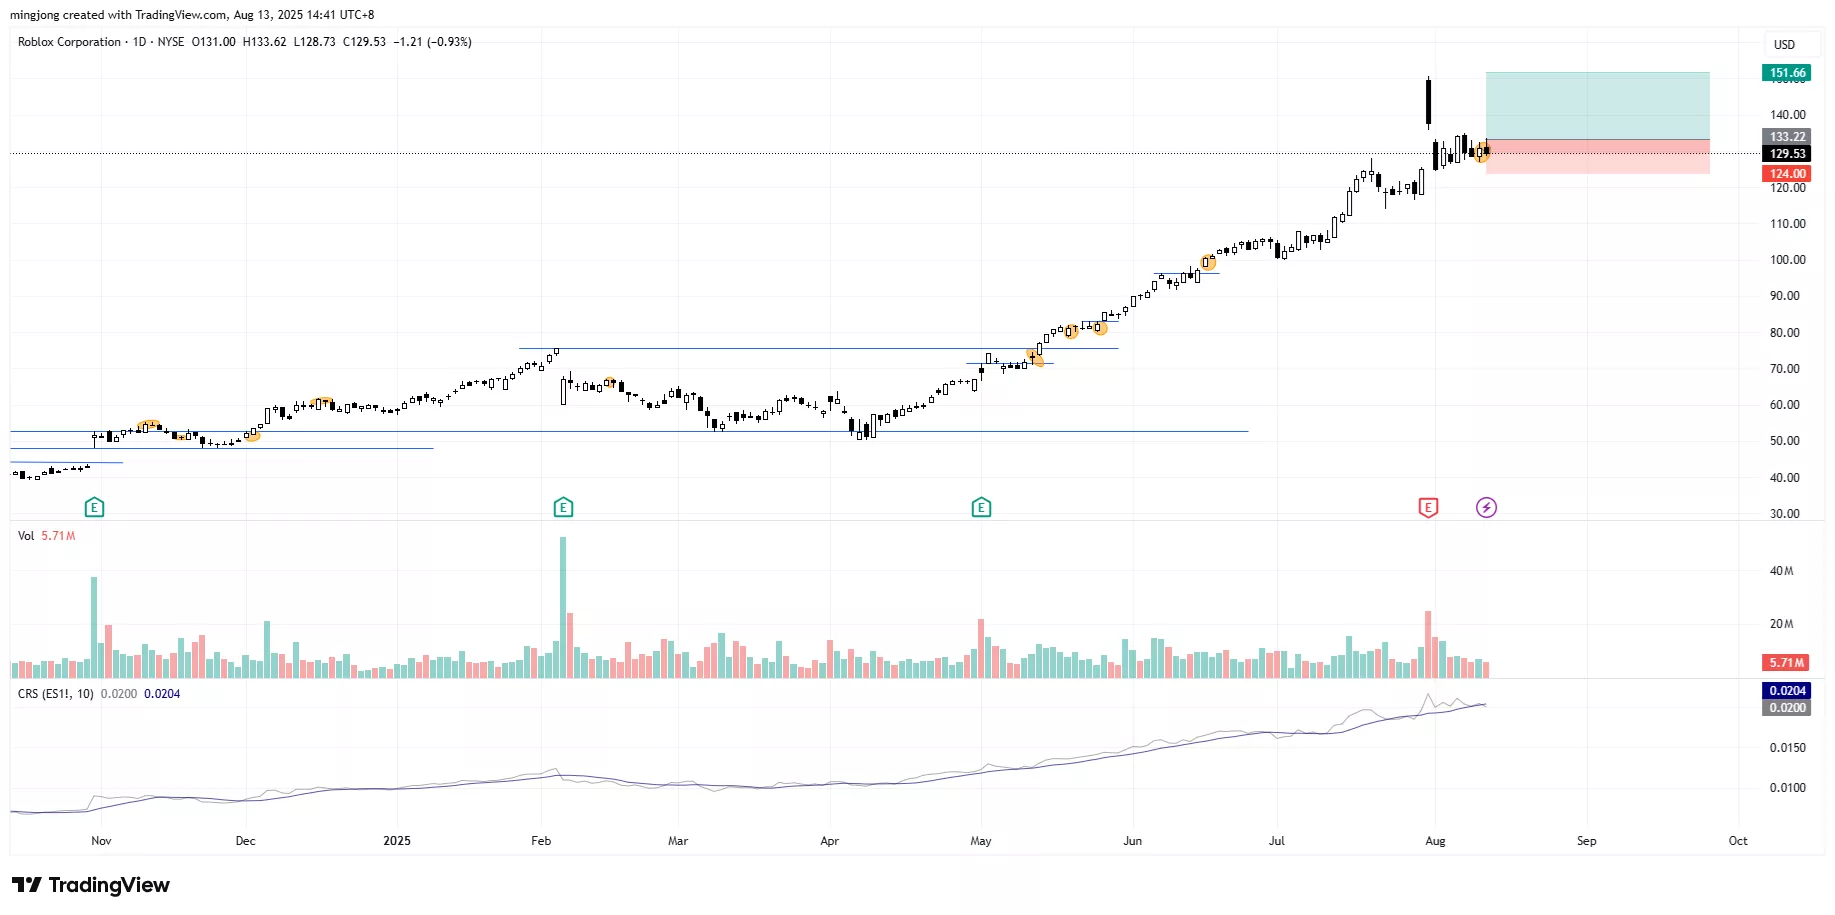
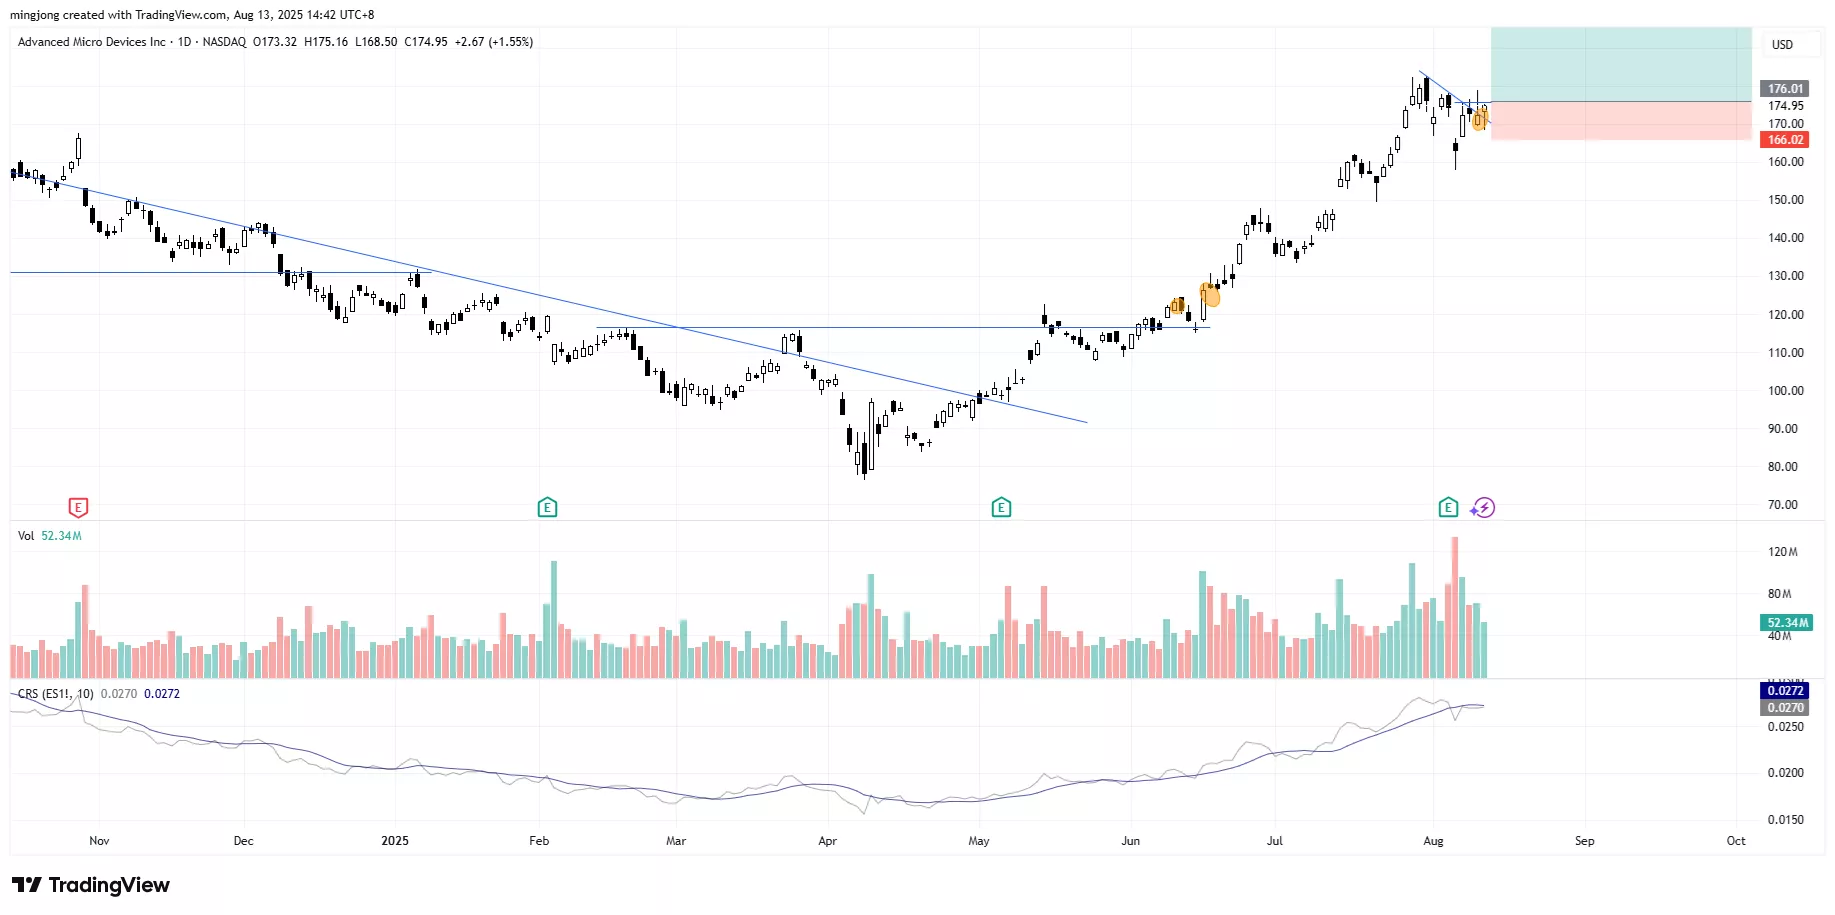
16 actionable setups such as CLS, RBLX, AMD were discussed during the live session on 12 Aug 2025 before the market open (BMO).
(Click on image to enlarge)
(Click on image to enlarge)
(Click on image to enlarge)
More By This Author:
First Major Red Flag Since April - Bigger Drop Coming?
The Bears Had Their Chance - But Here’s The Hidden Strength Keeping The Uptrend Alive
Could Demand Exhaustion Trigger A Sharp Pullback Into Seasonally Weak Months?
Disclaimer: The information in this presentation is solely for educational purpose and should not be taken as investment advice.


