
Bank of America Fund Manager Survey Update
On Tuesday, we put out a summary of the monthly Bank of America “Global Fund Manager Survey.” This month they surveyed 196 institutional managers with ~$490B AUM
Here were the 5 key points:
1) September saw the largest monthly rotation out of UK equities since April 2004, with positioning moving from a net 2% underweight to a net 20% underweight.
(Click on image to enlarge)

2) A record 58% of managers now view global equities as overvalued, up from 57% in August — once again, the most hated rally.
(Click on image to enlarge)

3) Growth expectations jumped 25% to a net 16% expecting the global economy to weaken, compared with net -41% in August, marking the biggest monthly increase since October 2024.
(Click on image to enlarge)

4) Equity allocation among managers rose to a seven-month high at a net 28% overweight as managers continue to play catch-up into year-end. Positioning remains far from stretched, leaving room for further buying and reinforcing our view that laggards will remain in favor.
(Click on image to enlarge)

5) Energy remains left for dead, with fund managers cutting allocation to a net 26% underweight from last month’s 16%, the lowest since May 2025. At 1.8 standard deviations below its long-term average, there are plenty of ponies in the pile, two of which we’ll touch on today.
(Click on image to enlarge)

Energy: We’ve Seen This Movie Before
At Great Hill Capital, we like to skate to where the puck is going, not where it has already been. While the market chases the latest AI darlings and shiny objects, we continue to see the unloved, boring corners of the market as hunting grounds ripe with opportunity. Last week, we highlighted the washed-out sentiment in Consumer Staples and two of our favorite names, Hormel and Diageo. This week, another sector left for dead stands out for similar reasons: Energy. Year to date, it has returned a meager +4.81%, placing it near the bottom of the barrel alongside Healthcare, Staples, and Real Estate, and well behind the S&P at +12.33%.
Weakness in the Energy sector is a movie we have seen (and profited from) many times before. Take 2020, for example. Energy was coming off being the worst-performing sector of 2019, had the lowest S&P weighting on record at just 3.5%, the highest short interest in nearly 20 years, and traded at less than half the market multiple. We saw this as a manna-from-heaven opportunity and bought as many shares of Exxon Mobil as we could get our hands on, which went on to become a multi-bagger in short order.
The point is that some of the best times to invest in any sector, let alone Energy, are when it feels the most uncomfortable. Fortunately for us, Mr. Market appears to be serving up one of those opportunities on a silver platter.
Sentiment has once again reached left-for-dead extremes not seen since the pandemic when oil briefly went negative and, before that, in the early 2000s.
As we have discussed in previous articles and podcasts, today’s setup bears striking parallels to the early 2000s, a period that set the stage for outperformance in small caps, international equities, and value. What gets less attention is that during that same stretch, Energy quietly became the top-performing sector of the decade. Whether we see a repeat or simply a strong run of outperformance, one thing is clear: it pays to be a buyer at these depressed levels.
Managers’ allocations have barely come off the mat from the record-low levels seen in May, with the sector currently 26% underweight and 1.8 standard deviations below its long-term average.
(Click on image to enlarge)
Energy’s weight in the S&P 500 has dropped to all-time lows of ~3%, levels not seen since oil went negative during the pandemic.

The Oil/S&P 500 ratio has fallen to near-record lows, with only two historical periods lower: 1999, which preceded a generational stretch of Energy outperformance, and the pandemic when oil went negative.

Short interest continues to rise, reaching multi-year highs at 13.2%.
(Click on image to enlarge)

When everyone piles into one side of a trade and the rubber band is stretched this far against any sector or company, that alone is enough to grab our attention. But what makes us even more curious is that while PRICE has taken a beating, FUNDAMENTALS tell a very different story. Earnings growth in 2026 is expected to reach 17.1%, the third-highest of any sector and well above the S&P at 13.7%.
(Click on image to enlarge)

So while Mr. Market continues to sell off the sector and investors get faked out by short-term headlines, whether it’s next week’s weather or supply-demand balances, we think it is completely missing the forest for the trees. Energy, particularly natural gas, is a SECULAR THEME driven by structural trends that aren’t just here to stay, they are growing by the day.
Here’s a statement you won’t hear anywhere else: owning Energy today is arguably the most overlooked pick-and-shovel play on AI.
Keeping that view in mind, you can imagine how much it makes us smile when Mr. Market punishes these names and serves up bargains based on a fleeting weather outlook…
So what drives that view? When it comes to AI, many investors today find themselves in the PREDICTION business. They are peering into a magic 8-ball, paying over 100x sales for the Palantir’s of the world, and guessing which high-flying AI names will be the winners of tomorrow. If AI delivers on its promises, these investors MAY be rewarded. The reason we say MAY, not WILL, is simple: price is what you PAY, VALUE is what you GET. At those sorts of nosebleed valuations, you have to ask yourself how many of these rosy scenarios are already baked in. We would go out on a limb and say quite a bit.
To us, it’s reminiscent of Amazon in 2000. The company hit nearly every promise it made (and then some), but investors were already paying for those outcomes many years in advance. Even as fundamentals improved over the next couple of years, investors were met with a 90% drawdown.
We cannot emphasize this enough: Price is what you PAY, Value is what you GET.
Rather than trying to be a hero and predict winners, we take a very different approach. If AI delivers on everything it has promised, the biggest beneficiaries will be the boring names where nobody is talking about AI. These areas are currently assigned zero value or benefit from AI, yet they stand to see a productivity boom.
On the other hand, if AI fails to live up to its lofty promises and proves far less transformative than many companies are betting on, tech stocks will come back down to earth and today’s shiny objects will disappear. In that scenario, we would expect a rotation back to everyday cheap, boring stocks.
The good news, and the reason we have singled out Energy as a top pick and shovel play, is that whether AI turns out to be transformational or not, Energy is the toll taker. Just to answer the question of AI’s impact, a massive buildout and the resulting energy demand is required, so in either scenario, Energy is a winner.
The fact of the matter is that AI needs power just as a diabetic needs insulin, and we want to be at the forefront of that.
Heads, we win big; tails, we still win.
Goldman Sachs estimates that data center demand will increase 165% by 2030, with 60% expected to be powered by natural gas.

Data center energy demand is projected to rise from 5% of total US power consumption today to over 10% by 2030.
(Click on image to enlarge)

ChatGPT queries are 6x–10x as power intensive as traditional Google searches.

After more than a decade of little change, US electricity consumption is set to grow at an average rate of 1.7% annually.

Here’s a great NYT article from last week making the case that value names could be some of AI’s biggest beneficiaries. I recommend reading it below.
(Click on image to enlarge)


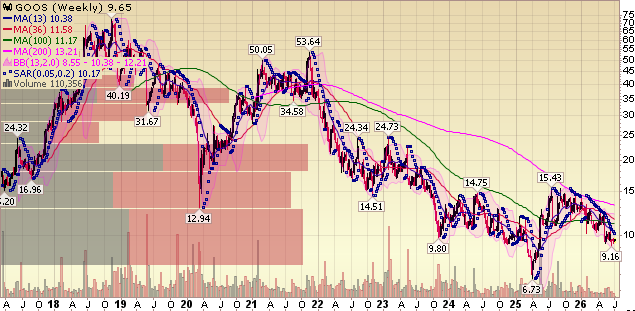
Comstock Resources (CRK) Update

Q2 Earnings Breakdown


10 Key Points
1) Natural gas and oil sales reached $344 million in Q2, up 24% year-over-year despite lower production. Comstock realized $3.02 per Mcf before hedging and $3.06 per Mcf after hedging, a significant improvement from last year’s $1.65. Most importantly, management remains very bullish on 2026, citing rising demand coming online and direct discussions with major customers about long-term supply agreements, with activity expected to ramp meaningfully in 2026.
2) Comstock continues to have the best-in-class cost structure among gas producers, with production costs 47% below the peer average. In Q2, production costs averaged $0.80 per Mcfe, down $0.03 sequentially and $0.04 year over year, driving a 74% cash margin. Management expects drilling efficiencies to further reduce D&C costs through the remainder of the year in both the western and legacy Haynesville areas.
3) Management continues to make progress deleveraging the balance sheet, paying down $35 million in debt during the quarter and improving the leverage ratio to 3x. Comstock ended the quarter with nearly $1.1 billion in liquidity and, importantly, reiterated that they have zero intentions of issuing equity for the foreseeable future. To further accelerate deleveraging, management plans to divest certain non-core properties in 2025 and has already received strong interest as new entrants move into the basin amid higher prices.
4) Management announced a new partnership with NextEra Energy to explore the development of gas-fired power generation assets near the Western Haynesville, aimed at serving potential data center customers. They believe the location, roughly 100 miles from both Houston and the Dallas Metroplex, has strong potential for data center development, and discussions with prospective customers are already underway.
5) Comstock has begun utilizing Horseshoe Wells, which have delivered up to a 35% reduction in drilling costs, averaging $800 per lateral foot compared to $1,240 for a short lateral. The Legacy Haynesville inventory now includes 149 future Horseshoe locations, with management planning nine Horseshoe wells in 2025 and ten in 2026, and no drilling issues reported to date. These drilling cost savings, combined with the lowest transportation costs in the industry thanks to highly attractive Gulf access, will continue to support Comstock’s best-in-class cost structure.
6) Management continues to view wells in the Western Haynesville as some of the best they have ever drilled and have never been more encouraged by the opportunity set in the region. The Western Haynesville footprint has expanded to nearly 525k net acres, with 29 wells drilled to date and 24 currently producing. Management expects the Western Haynesville to yield significantly more resource potential per section than the Legacy Haynesville.
7) Management now expects to drill 19 wells and turn 13 to sales in 2025 in Western Haynesville, and to drill 32 wells and turn 32 to sales in Legacy Haynesville. Based on current drilling inventory, Comstock now has over 30 years of drilling based on 2025 activity.
8) Operating cash flow in Q2 was $210 million, up significantly from $118 million in the same quarter last year. This brings year-to-date operating cash flow to $448.6 million, compared with $300 million at the same point in 2024.
9) Thanks to the passage of the One Big Beautiful Bill, Comstock expects a meaningful benefit on tax rates and does not anticipate any significant tax liability from non-core property sales, further supporting stronger cash flow ahead.
10) The Marquez gas treating plant began operations in July, effectively doubling Comstock’s treating capacity by more than 400 million cubic feet per day.
Earnings Call Highlights


National Oilwell Varco (NOV) Update

Q2 Earnings Breakdown
(Click on image to enlarge)


10 Key Points
1) NOV reported second-quarter revenues of $2.19 billion, up 4% sequentially and down 1% year over year, beating Street consensus by $41 million. Adjusted EBITDA declined 10% year over year to $252 million, or 11.5% of sales compared with 12.7% last year, driven by higher tariff-related costs and a less favorable sales mix.
2) The Energy Equipment segment generated revenue of $1.21 billion during the quarter, flat year over year and up 5% sequentially, with adjusted EBITDA of $158 million, or 13.1% margin, up 130 basis points YoY. Most importantly, this marks the segment’s 12th consecutive quarter of year-over-year margin expansion. New orders totaled $420 million, down $557 million YoY, while the backlog for capital equipment orders stands at $4.3 billion, a slight decline of $31 million year over year.
3) Management continues to expect Offshore to return to growth and reaccelerate in 2026 as discussions advance on multiple Deepwater programs. While operators have delayed projects and final investment decisions, there are no indications of cancellations. NOV continues to see a healthy pipeline of FPSO (Floating Production, Storage, and Offloading) awards, each representing $100–$700 million in revenue, with industry forecasts calling for up to 50 FPSOs through the end of the decade.
4) Cash from operations totaled $191 million for the quarter, while free cash flow came in at $108 million, bringing trailing twelve-month free cash flow to $909 million and driving an EBITDA-to-FCF conversion rate of 83%. Management continues to implement structural improvements to working capital, resulting in a 300 bps year-over-year improvement as a percentage of revenue.
5) Management announced a company-wide cost reduction initiative targeting more than $100 million in annual savings by the end of 2026, partially offset by tariffs and inflation headwinds. These savings will come from centralizing business processes, lower-cost sourcing, facility consolidations, and exiting product lines in markets where returns are insufficient, with the latter expected to be accretive to NOV’s margins and return on capital.
6) NOV recorded a tariff expense of $11 million during the quarter as it continues to leverage its supply chain, manufacturing footprint, and opportunities under USMCA to reduce the impact. Unmitigated, tariff exposure stands at approximately $300 million annually. Management expects tariff-related costs to reach $20–25 million in Q3 and $25–30 million in Q4, after which expenses should stabilize as mitigation and pricing actions take effect.
7) Management returned $176 million of capital to shareholders during the quarter through share repurchases and buybacks, continuing their pledge to return at least 50% of excess free cash flow. Year-to-date, share repurchases total 10.9 million shares for $150 million, at an average cost of $13.76 per share, while dividends paid year-to-date amount to $135 million.
8) NOV continues to maintain a rock-solid balance sheet, with $1.08 billion in cash and cash equivalents (around 23% of market cap), $1.5 billion available on its primary revolving credit facility, and total debt of $1.73 billion, with the next maturity not until 2029. This implies a net debt leverage ratio below 1x and a gross debt leverage ratio below 2x, supporting its investment-grade credit rating.
9) Capital expenditures during the quarter totaled $83 million, or just 3.8% of sales, bringing year-to-date capex to $167 million compared with $151 million at the same point last year. Management expects second-half capex to be roughly in line with, or slightly higher than, last year as they continue to prioritize investments with high returns on capital.
10) For the second half of the year, management sees global activity slowing further but expects NOV’s backlog and international tool purchases to support flat to modest sales growth compared with the first half. For Q3 specifically, management expects year-over-year revenues to decline 1–3% and adjusted EBITDA to range between $230 million and $250 million.
Earnings Call Highlights
(Click on image to enlarge)


General Market
The CNN “Fear and Greed Index” ticked up to 58 this week from 51 last week. You can learn how this indicator is calculated and how it works here: (Video Explanation)

The NAAIM (National Association of Active Investment Managers Index) (Video Explanation) ticked up to 86.11% this week from 81.58% equity exposure last week.
(Click on image to enlarge)

More By This Author:
“Don’t Count The Staples Out” Stock Market (And Sentiment Results)
“The Capitulation Rally” Stock Market (And Sentiment Results)
“Fed Opens The Floodgate” Stock Market (And Sentiment Results)…


Comments
Log in or sign up to join the conversation.