

Image Source: Pexels
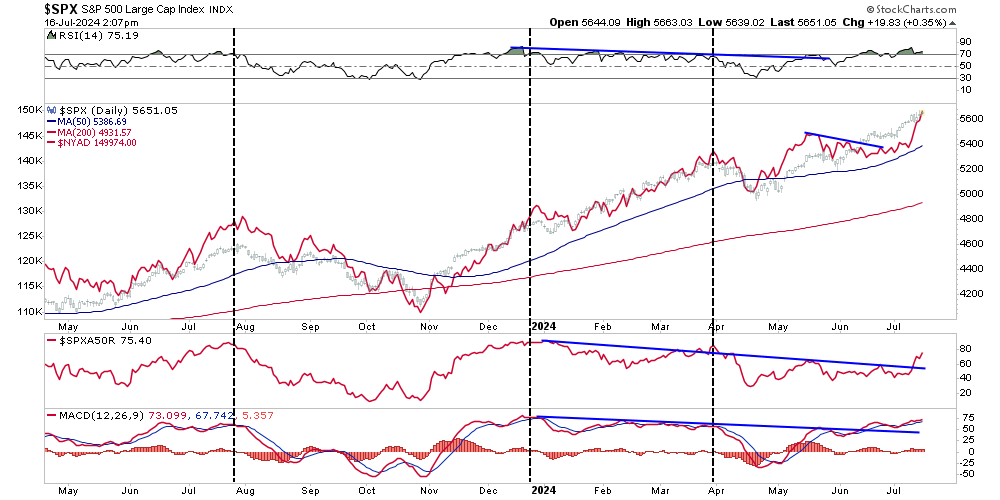
We noted last Friday that over the previous few years, a handful of “Mega-Capitalization” (mega-market capitalization) stocks have dominated market returns and driven the bull market. In that article, we questioned whether the dominance of just a handful of stocks can continue to drive the bull market. Furthermore, the breadth of the bull market rally has remained a vital concern of the bulls. We discussed that issue in detail in “Bad Breadth Keeps Getting Worse,”
“While the market is making all-time highs as momentum continues, its breadth is narrowing. The number of stocks trading above their respective 50-DMA continues to decline as the market advances, along with the MACD signal. Furthermore, the NYSE Advance-Decline line and the Relative Strength Index (RSI) have reversed, adding to the negative divergences from a rising market. While this does not mean the market is about to crash, it does suggest that the current rally is weaker than the index suggests.“
Since the beginning of this year, the “bad breadth” issue has been a concern for the current bull market rally. Such is because, historically speaking, periods of narrow market advances typically precede short-term corrections and bear markets. As Bob Farrell once noted:
“Markets are strongest when broad, and weakest when narrow.”
However, as the Federal Reserve prepares to cut rates for the first time in 2020, there seems to be a change afoot. Following the most recent Consumer Price Index (CPI) report, there was an evident rotation from the previous market leaders to the laggards. More importantly, the breadth of the market has improved markedly, with the NYSE Advance-Decline hitting all-time highs. Furthermore, the previous negative divergences in the Relative Strength Index (RSI) and the number of stocks above their 50-DMA also reversed higher.
What does that mean?
“The market action as of late has been refreshing and could be the sign of a maturing bull market, where a wide range of stocks are contributing to the rally, providing more support for stock indexes at record levels.” – Yahoo Finance
Historically, improving breadth suggests that the bull market’s health is improving. However, while breadth has undoubtedly improved, with the bulls encouraged by the prospect of Federal Reserve rate cuts, is the recent broadening of the market sustainable? Maybe. However, as Sentiment Trader recently noted:
“After more than a month of meaningful divergences between indexes and individual stocks, those were largely resolved in a historic shift late last week. While a new high in cumulative breadth has been a positive long-term sign, returns were more questionable in the shorter term when the S&P 500 had far outpaced market-wide breadth.”
In this particular case, we agree. There are risks to this current rally in small-cap stocks worth understanding.
Risks To The Russell
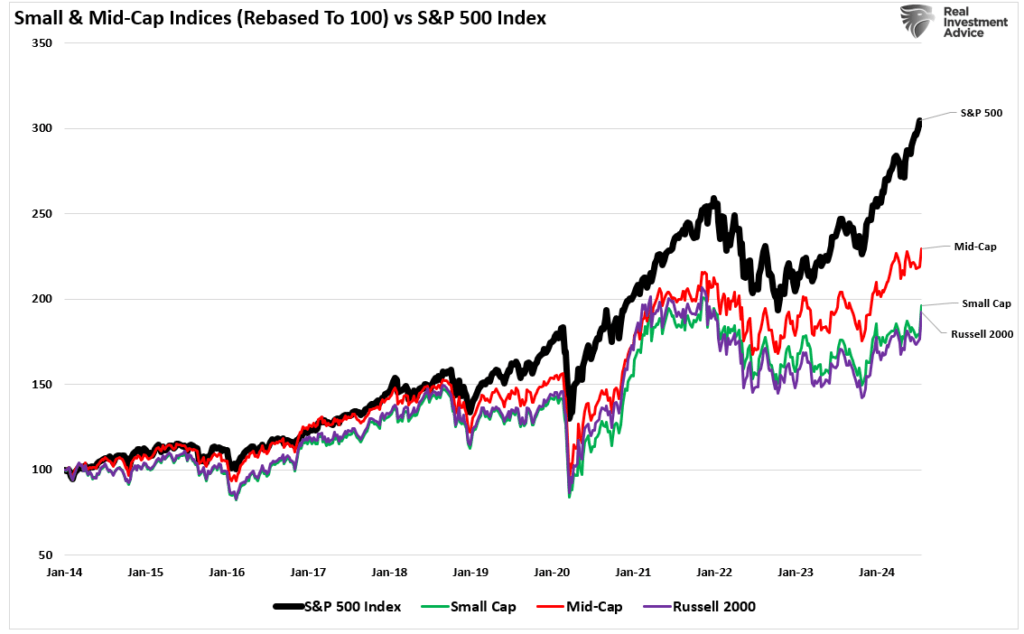
With the Fed cutting rates and the prospect of a pro-growth, tax-cut, and tariff-friendly President, it is unsurprising to see narratives about why the market rally will broaden with Small and Mid-capitalization companies taking leadership.
However, while such could be the case, many problems still plague these companies. As we noted in this past weekend’s Bull Bear Report:
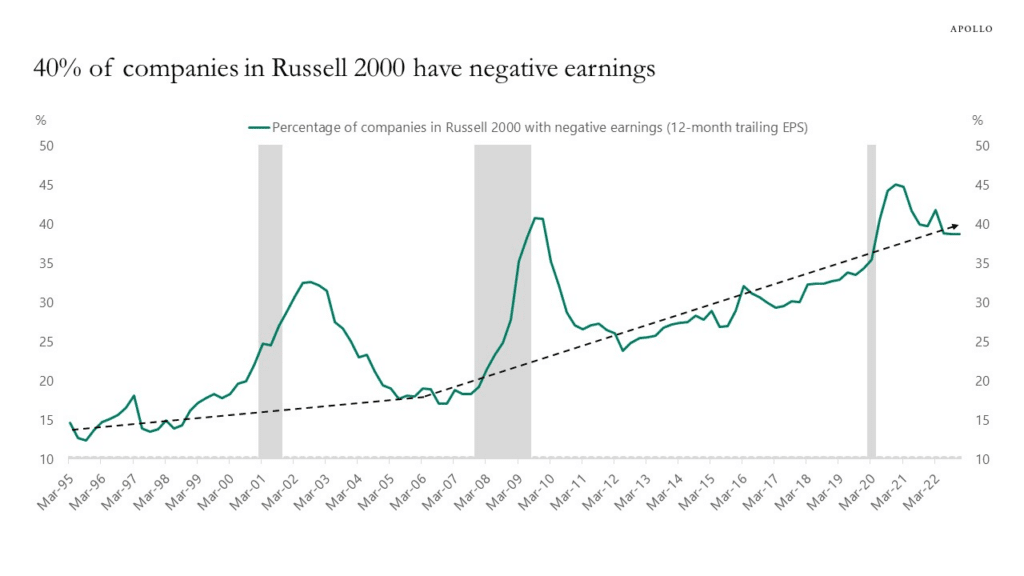
First, nearly 40% of the Russell 2000 is unprofitable.
“However, some issues also plague smaller capitalization companies that remain. The first, as noted by Goldman Sachs, remains a fundamental one.
“I’m surprised how easy it is to find someone who wants to call the top in tech and slide those chips into small cap. Aside from the prosect of short-term pain trades, I don’t get the fundamental argument for sustained outperformance of an index where 1-in-3 companies will be unprofitable this year.”
As shown in the chart by Apollo below, in the 1990s, 15% of companies in the Russell 2000 had negative 12-month trailing EPS. Today, that share is 40%.”
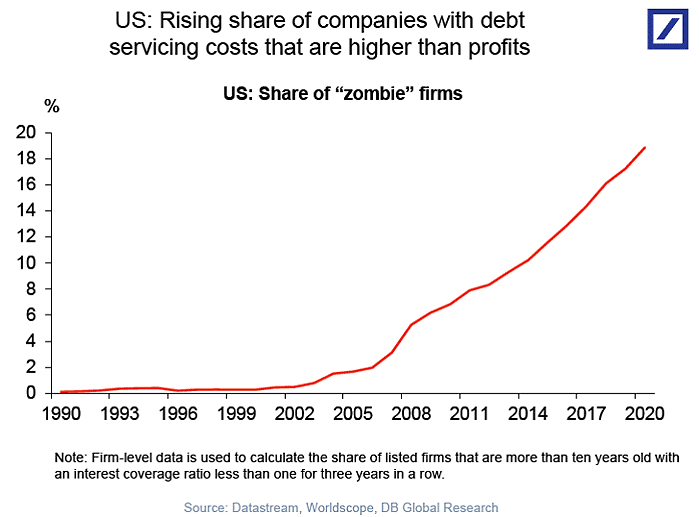
Besides the apparent fact that retail investors are chasing a rising slate of unprofitable companies, these companies are also heavily leveraged and dependent on debt issuance to stay afloat (a.k.a. zombies.) These companies are susceptible to actual changes in the underlying economy.
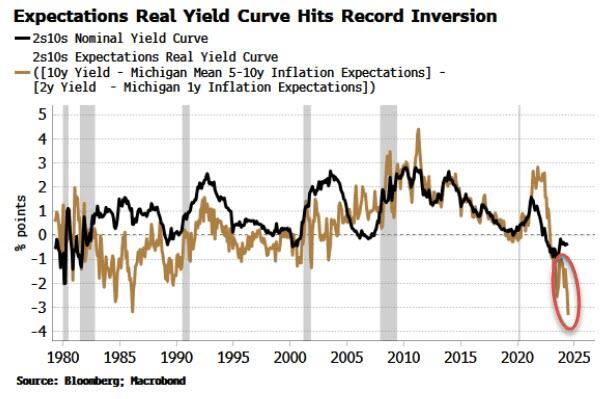
With a slowing economy, these companies depend highly on the consumer to generate revenues. As consumption decreases, so does their profitability, which will weigh on share performance. Such was a point made by Simon White via Bloomberg last week:
“The yield curve based on inflation expectations has flattened significantly and is now more inverted than it ever has been – and it will remain under pressure in the event of a Trump presidential victory. This “expectations curve” shows that consumers are anticipating much tighter financial conditions than inferred by the market via the nominal yield curve, presenting a risk to consumption, broader economic growth and equity valuations and returns.“
Furthermore, the companies in the Russell 2000 (a good proxy for small- and mid-capitalization companies) do not have the financial capital to execute large-scale buybacks to support asset prices and offset slowing earnings growth by reducing share count. As we noted previously, since 2000, corporations have been the sole net buyers of equities, which has created a substantial outperformance over time by large capitalization stocks.
However, while the rally’s breadth has improved, those headwinds may substantially challenge the bull market’s sustainability.
Breadth Has Improved, But Is it Enough?
A market rally needs buyers to be sustainable.
If the current rotation were occurring from a deeply oversold condition following a broader market correction, I would be a stronger believer in its sustainability. However, as we have noted previously, investors (both retail and professional) are exceptionally bullish.
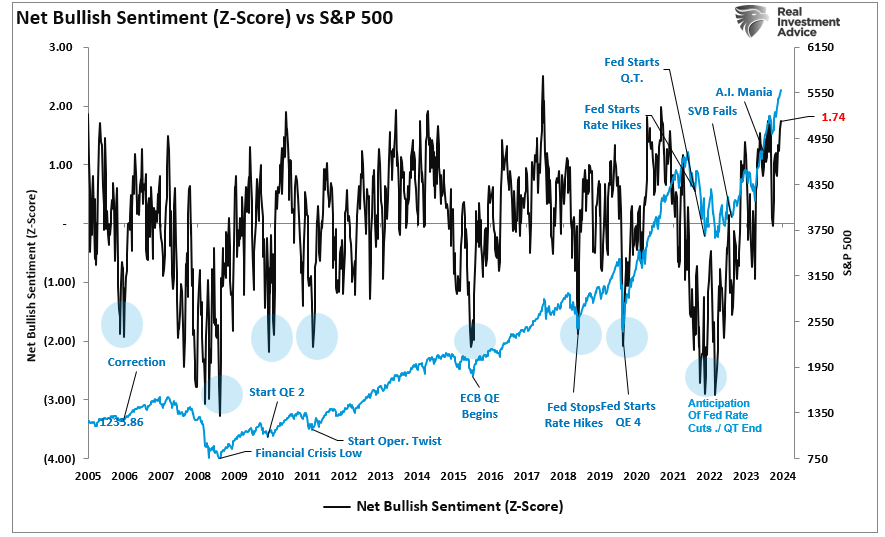
Furthermore, with that bullish sentiment, investors are fully allocated to equities. The chart below shows the average equity allocation of both retail and professional investors. Historically, readings above 80 are associated with near-market peaks. The current reading is 87, which is in more rarefied air.
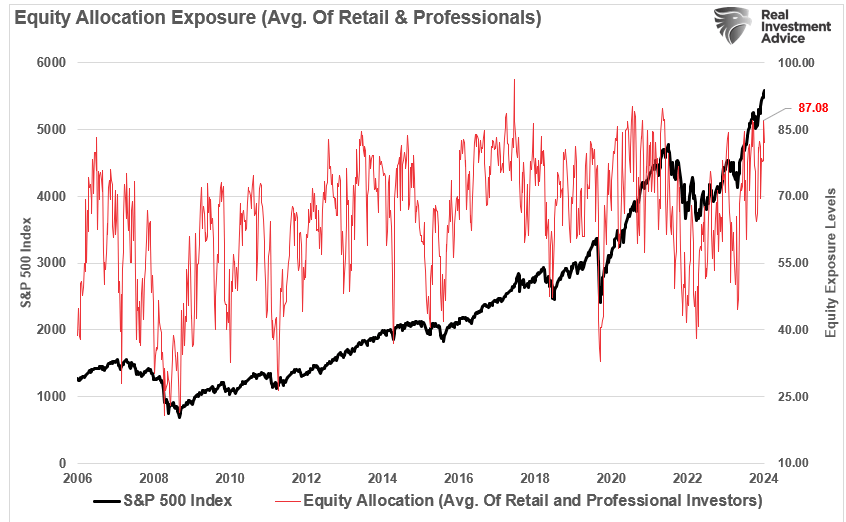
Given the more aggressive equity allocation levels, which also translates into low cash levels, the ability to take on more exposure to continue to boost the market higher is somewhat questionable.
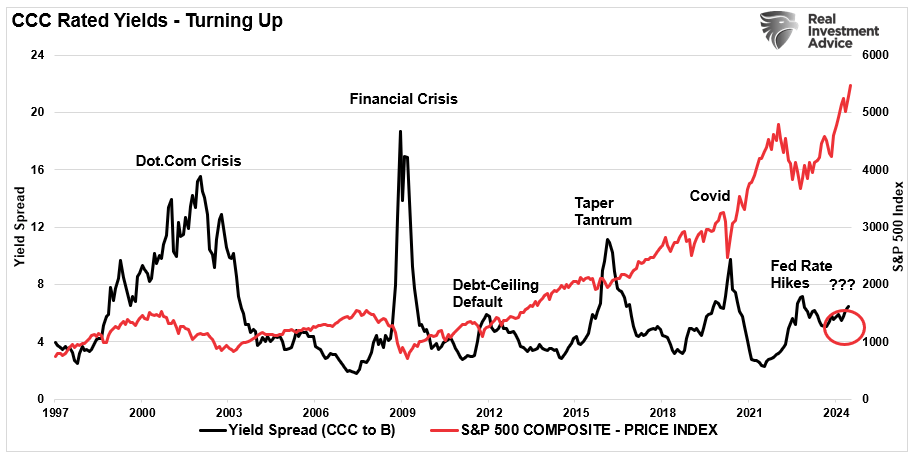
Lastly, while the market sentiment is bullish, we are beginning to see some early cracks in the credit market. Historically, when credit spreads start to widen, such has preceded a rise in market volatility. As shown, the yield spread on junk bonds is rising again. While early, such increases between CCC-rated and B-rated corporate bonds have been an early warning sign of market stress.
Yes, the market could continue a massive rotation from large-cap to small and mid-capitalization companies. However, given the current levels of bullish sentiment and allocations against a backdrop of weakening economic data and widening spreads, this suggests the current rotation may be nothing more than a significant short-covering rally. Furthermore, the current technical overbought and extended conditions also suggest sustainability remains questionable.
With investors already heavily allocated to equities, the question remains: “Who is left to buy?”
Furthermore, the risk remains with a broader market correction heading into the election. Such would likely impact large and small-cap companies.
As Yahoo suggests, could this be the start of the real bull market?
Of course, markets can always do the unexpected. If the rotation continues and the economic backdrop improves markedly, supporting earnings growth, we will modify our portfolios accordingly.
It is possible.
However, we will remain in our portfolio management process’s “show me” phase until the market convinces us differently.
More By This Author:
Small Stocks Dominate Large Ones - What Comes Next?Russell 2000 Explodes Higher As Rotation Takes Hold
Stock Rotations On Steroids


Comments
Log in or sign up to join the conversation.