

Image Source: Unsplash
Volatility has returned to equity markets, and the Magnificent Seven stocks are under pressure as the AI bubble continues to expand.
What are Momentum Stocks?
Momentum stocks are publicly listed companies with a significant catalyst driving share prices higher. Cyclicality, secular growth, and corporate events such as earnings releases, mergers and acquisitions, and technical or medicinal breakthroughs are core drivers of momentum stocks. Momentum investors also rely on technical indicators, such as the Relative Strength Index (RSI) and the Moving Average Convergence/Divergence (MACD).
Why Should You Consider Investing in Momentum Stocks?
Market conditions change, and successful investors and traders know when to apply which strategy to ensure maximum returns with minimal risk. Buying momentum stocks can improve returns if investors understand what to look for.
Here are a few things to consider when evaluating momentum stocks:
- Focus on momentum stocks that have outperformed the S&P 500 Index over the past twelve months.
- Invest in momentum stocks that are in an upward cycle or that experience secular growth.
- Analyze momentum stocks in trending industries where they have a disruptive impact.
- Use technical indicators like the MACD or the RSI to fine-tune your entry levels.
- Keep up to date with the data and news flow to make necessary adjustments and exits, as momentum can swing swiftly.
What are the Downsides of Momentum Stocks?
Momentum stocks can swiftly lose their momentum and reverse direction. Investing in momentum stocks requires an active approach, which is time-consuming and not ideal for most retail investors. Momentum investors must also brace for volatility and differentiate between momentum-keeping short-term events and momentum-changing developments.
Here is a shortlist of currently attractive momentum stocks:
- Futu Holdings (FUTU)
- Vertiv Holdings (VRT)
- Planet Labs PBC (PL)
- Flex (FLEX)
- Select Medical Holdings (SEM)
- uniQure (QURE)
- Richtech Robotics (RR)
- Western Digital Corporation (WDC)
- Amprius Technologies (AMPX)
- D-Wave Quantum (QBTS)
Update On My Previous Best Momentum Stocks to Buy Now
In my previous installment, I highlighted the upside potential of Futu Holdings and Vertiv Holdings. Here is a brief update on these stocks.
- Futu Holdings: A long position was taken in Futu Holdings stock between $177.51 and $191.60. The stock rose by more than 14% before retreating. It has remained in positive territory, and I am holding onto my long positions, as I see more upside ahead.
- Vertiv Holdings: A long position was taken in Vertiv Holdings stock between $121.41 and $134.93. The stock skyrocketed nearly 70%, and I closed my positions at $200. It delivered a nice earnings beat, and the uptrend has remained intact, but I see more choppiness and a potential correction ahead.
Planet Labs PBC Fundamental Analysis
Planet Labs PBC is a global leader in satellite data and analytics. It is also active in the defense and intelligence sector. The stock is also a member of the Russell 2000 Index.
So, why am I bullish on Planet Labs PBC after a rally of +100% since August?
Planet Labs PBC signed an eight-figure contract extension with an unnamed international defense and intelligence customer. It follows similar deals announced with the German government, NATO, the US Department of Defense, the US Navy, and the US National Geospatial-Intelligence Agency. Free cash flow is positive, earnings per share rise at an impressive rate, gross margins remain excellent, and the rising return on capital is encouraging.
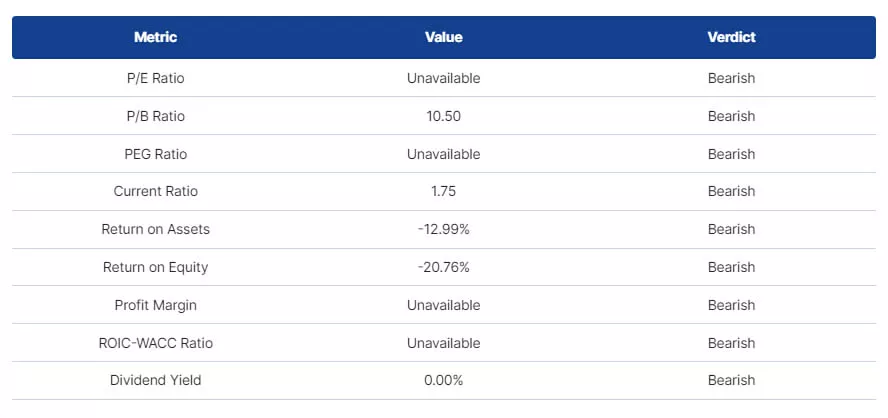
Planet Labs PBC Fundamental Analysis Snapshot
The price-to-earnings (P/E) ratio is unavailable. The average analyst price target for Planet Labs PBC is $14.55. This suggests moderate upside potential with acceptable downside risks.
Planet Labs PBC Technical Analysis

(Click on image to enlarge)
Planet Labs Price Chart
The D1 chart shows the stock's price action trading between its ascending 50.0% and 61.8% Fibonacci Retracement Fan levels. It also shows Planet Labs PBC inside of a horizontal support zone.
Additionally, the Bull Bear Power Indicator is bullish with an ascending trendline.
My Call on Planet Labs
I am taking a long position in Planet Labs PBC between $11.97 and $14.02. While operational statistics are bearish across the board, they are moving in the right direction, led by 20%+ annual revenue growth, rising return on assets, and positive free cash flow from operations. Becoming a member of the Russell 2000 this summer is a testament to its bright outlook.
FLEX Ltd. Fundamental Analysis
FLEX Ltd. is the third largest global electronics manufacturing services (EMS) and original design manufacturer (ODM) company by revenue. It has manufacturing operations in over 30 countries and employs over 170,000 people. FLEX Ltd. is also a member of the S&P 400 Index.
So, why am I bullish on FLEX Ltd. after its earnings beat?
Revenues rose to $6.8 billion with earnings of $0.79, while raising its guidance by over $500 million, driven by expected growth in its data center business. It noted that most tariffs are pass-through tariffs.
I am bullish on FLEX Ltd. and its diversified mix of customers, including cloud infrastructure, AI data centers, automotive, and healthcare. The expected earnings-per-share growth rate of over 17% exceeds the industry average, and I see more upside for FLEX Ltd.
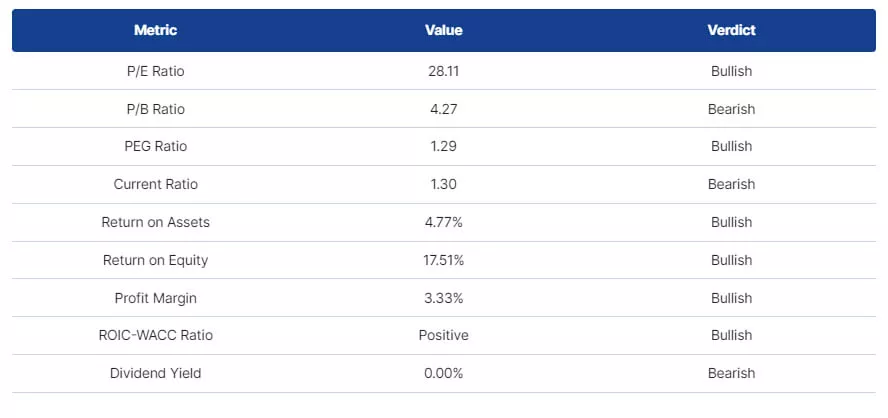
FLEX Ltd. Fundamental Analysis Snapshot
The price-to-earnings (P/E) ratio of 28.11 makes FLEX Ltd. an inexpensive stock. By comparison, the P/E ratio for the S&P 500 Index is 30.27. The average analyst price target for FLEX Ltd. is $74.37. This suggests good upside potential with reasonable downside risk.
FLEX Ltd. Technical Analysis

(Click on image to enlarge)
FLEX Ltd. Price Chart
The D1 chart shows the stock's price action between its ascending 0.0% and 38.2% Fibonacci Retracement Fan levels. It also shows the stock inside a bullish price channel.
Additionally, the Bull Bear Power Indicator is bullish with an ascending trendline.
My Call on FLEX Ltd.
I am taking a long position in FLEX Ltd. stock between $61.50 and $66.05. FLEX Ltd. has an excellent client mix across core growth sectors, maintains an impressive EPS growth rate, and raised its outlook amid expected demand growth.
More By This Author:
Weekly Forex Forecast - Sunday, Nov. 9EUR/USD Forex Signal: Bullish Breakout From Bearish Price Channel
Eli Lilly And Company Stock Signal: Did Earnings Justify The Rally?


Comments
Log in or sign up to join the conversation.