The “3 Magic Words” Stock Market (And Sentiment Results)
Image Source: Unsplash
On Tuesday, I joined legendary anchor Larry Mendte (over 80 regional Emmy’s in his career) on the Mark Simone Show 710 WOR AM (iHeart Radio). This show is #1 nationwide in its daily time slot from 10 am-12 pm. It is heard by over 22 million radio and TV listeners a month. In this segment with Larry, I covered the “Magic 3 Words” that could change everything on a dime (hint: they are NOT Volker’s words, “keep at it”). Thanks to Larry for having me on. Here were my show notes ahead of the segment:
-CENTRAL BANK POLICY
- Terminal rate pushed from 4.6% to 5.1% in Fed’s dot plot last Wednesday. FFR at 4.25-4.50%. Caused selloff.
- While market did not like it, market also did not BELIEVE it. 2yr yield trading closed week at 18% (below FFR) and 10yr yield closed at 3.48% signaling a slowdown if they do not pause soon.
- The first move in equities (following an FOMC decision) is often the wrong move, so we’ll see how things play out in coming sessions.
- Headline CPI was up .1% month on month on Tuesday. If that pace persists, we’ll be below 3% by May (currently 7.1%).
- Fed’s preferred metric of Core PCE would be MUCH LOWER THAN THE FED IS PROJECTING – 5% for 2023 (currently 5%).
- Maximum of one more hike (25bps) and then a long pause to see the lagged effects of this aggressive tightening cycle.
- 1982:
- S&P dropped 27% when Volker was tightening in 1981-1982. Market bottomed in August 1982 when inflation was still at 93%. On October 5, 1982 (while inflation was still 6.55%), Volker said he “may shift tactics.” The stock market recovered 100% of the losses within 4 months and went on to make new ALL-TIME highs the next year.
- Most analysts are calling for earnings to come down another 20% and are therefore bearish on the market. History shows the stock market bottoms WELL BEFORE earnings. In most cases the S&P 500 had recovered to new highs by the time earnings bottomed 6-12 months later: 1957, 1974, 1982, 1990, 2009, 2020.
-RECESSION?
- $9.5T of liquidity was pumped into the system during the pandemic (between fiscal and monetary policy).
- M2 money supply is collapsing (which will bring a more precipitous drop in headline inflation in coming months).
- Corporate and Personal balance sheets are still in good shape.
- The pathway to a soft landing is narrowing, but still possible if the Fed pauses early next year. Would be similar to 1994-1995 pause.
- Fed wants to see labor market cool and with their target of 4.6% unemployment in 2023. That implies 1.2M jobs lost.
- Just as Fed projected a 1% fed funds rate for 2022 (now 4.25-4.50%), it is equally unlikely their 1% projection (above) will be correct for 2023.
- 5 year inflation breakevens now at 2.14%. This is below May 2018 levels of 2.16%. Fed’s “Hawk Talk” reducing long-term inflation expectations as intended.
- Recognition of the lagged effect and staying data dependent moving forward in FOMC statement. Gives them cover to PAUSE on the dime if data confirms slowdown before February meeting.
- When their projections CHANGE, they change quickly and without notice or apology
- Since 1954 average 12mo return after Fed PAUSES = 14% (n=13)
-SANTA CLAUSE RALLY?
- The Fed talk was tough on the market in the short term.
- December is historically weak the first half of the month.
- Tax-Loss selling abating, seasonality improving.
- We think the Grinch may be pushed out of Santa’s sleigh and we could see some buying into year end.
- Positioning too bearish. Highest cash levels since pandemic lows and GFC lows. No one positioned for good news.
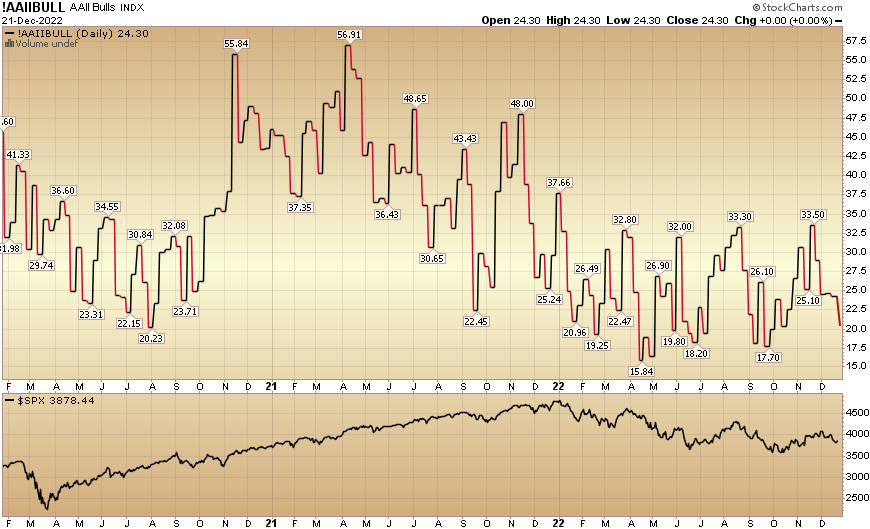
- AAII Sentiment Survey 24% bullish (contrarian indicator).
-Emerging Markets:
Emerging Markets (EEM) now trading at 2007 prices. Historically trade opposite the $USD. When the Dollar stops going up as it did in 2002, 2009, 2016, and 2020, you will see a monster rally in EEM – just as we saw:
+480% from 2002-2007
+189% from 2009-2011
+96% from 2016-2018
+97% from 2020-2021
- Emerging markets will be the best trade over the next few years.
- U.S. dollar has fallen ~10% in last 2 months. This is key to emerging markets trade.
- People underestimating the impact of China’s abrupt reopening. They have done an about-face on Internet Platforms and want to support consumption.
- China set 5% GDP goal for 2023 last week.
- Will follow through with aggressive monetary policy. “Forceful Stimulus”
- Can stimulate BIG as no inflation worries. They built energy storage and have low inflation.
- BABA and JD got positive review from PCAOB trip to Hong Kong.
- This will attract institutional investors back into the fold.
- As China is heaviest weight in Emerging Markets index, more money will flow into basket as China recovers quickly in 2023.
Sentiment and Data
Before we begin this section, a friendly reminder from yours truly:
BEARS/Pessimists always SOUND sophisticated and smarter than the rest, but BULLS/Optimists wind up with all of the money over time.
It’s the difference between having GAMBLER’S ODDS or CASINO ODDS. Over time, the CASINO TAKES ALL as the odds are stacked in their favor. Over time, BULLs make all the money as the market goes up 70% of the time. The key is to sit tight [and possibly add to high quality businesses (not speculative pipe-dreams) that are temporarily marked down] when the wind blows from time to time.
I’ve never met a wealthy perma-pessimist…
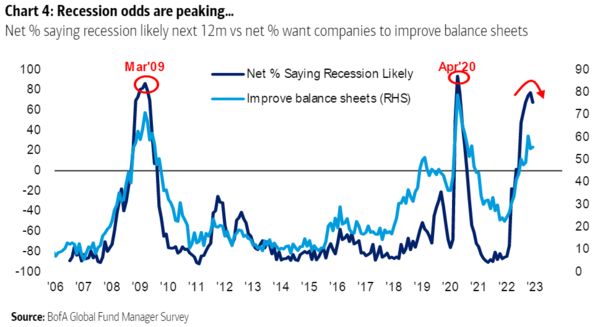
While consensus continues to call for a NEW LEG LOWER (due to falling earnings and a recession) in the first half of the year, we continue to take the other side. Here’s Barron’s cover from this weekend:
(Click on image to enlarge)

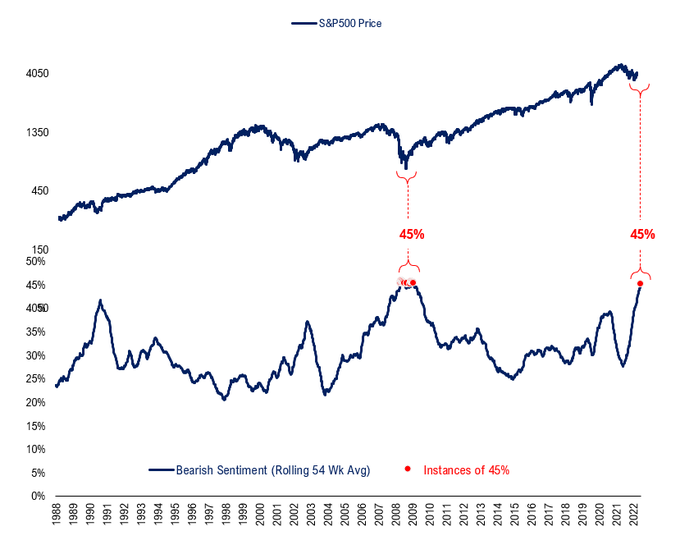
Here’s a long-term look at sentiment from Fundstrat:
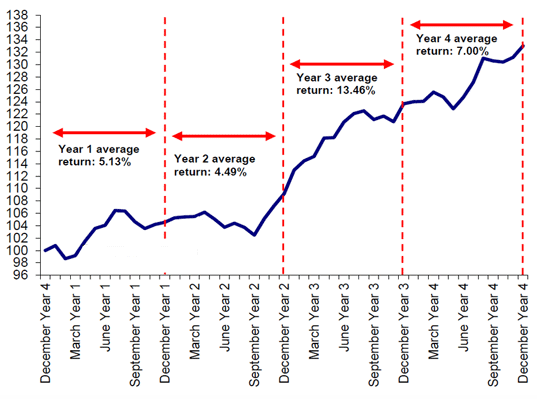
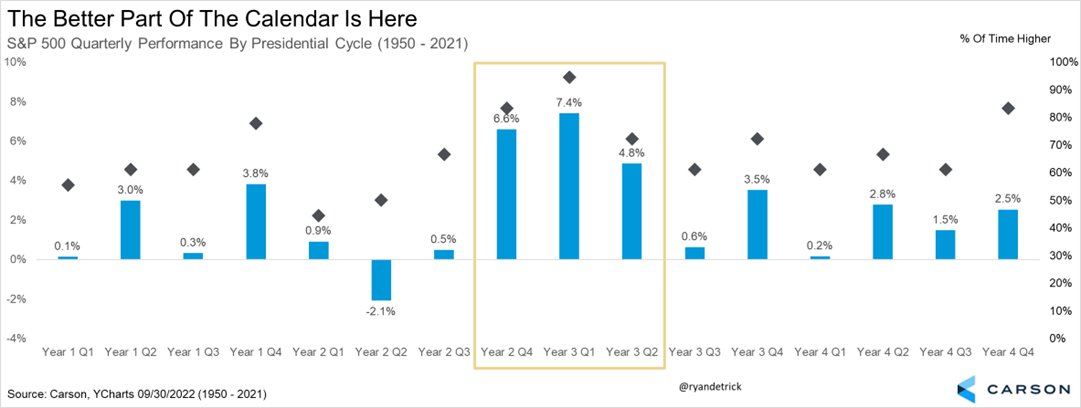
If you look at history, the third year of the four-year Presidential Cycle (especially the first two quarters) is the strongest year for Stock Market performance. It follows the WORST year of the Presidential Cycle (2nd year) or in present-day – 2022.
Source: BofA, Bloomberg
(Click on image to enlarge)
Source: Ryan Detrick
So far the first 2 years of this Presidential Cycle have followed the script. As we have covered many times in recent weeks, even if consensus is RIGHT that earnings will come down a lot more – we believe they are WRONG about how the market will respond. As I covered on both media hits above, the stock market bottoms 6-12 months BEFORE earnings bottom. So even if the pessimists are right, historically you get paid to buy equities now (or on October 13th when we were publicly pounding the table at the 3,590 S&P lows on Benzinga).

Source: JPM
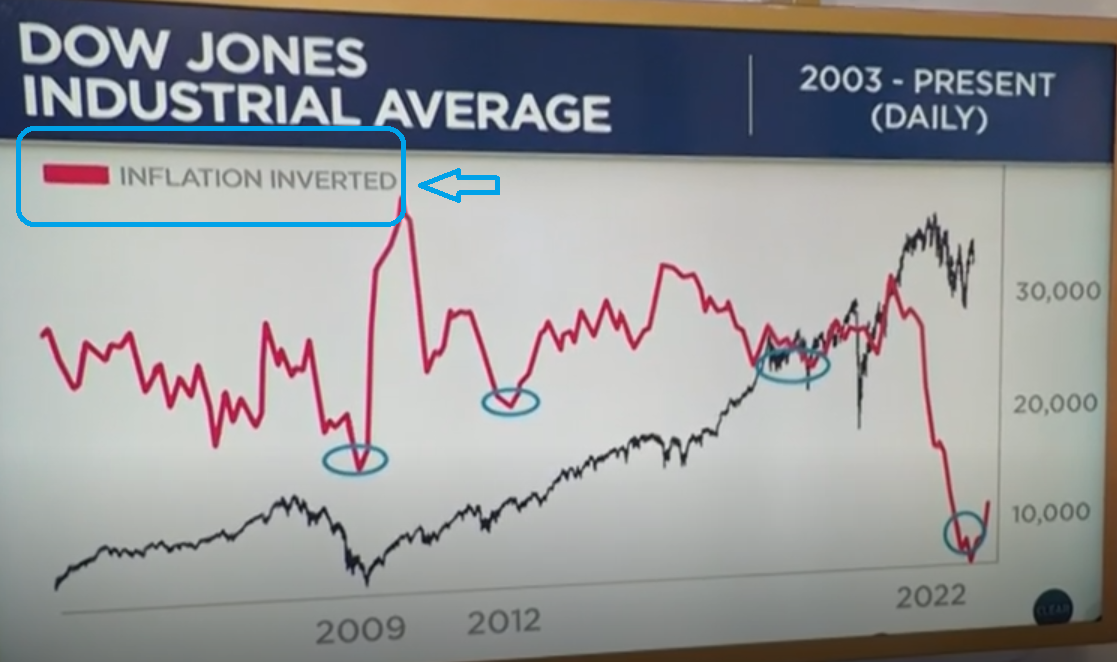
As we all know, inflation has already peaked. The question now is how quickly will it fall. But in reality it may not matter because historically, once the peak is in, the market has bottomed:
(Click on image to enlarge)
Larry Williams via CNBC Mad Money
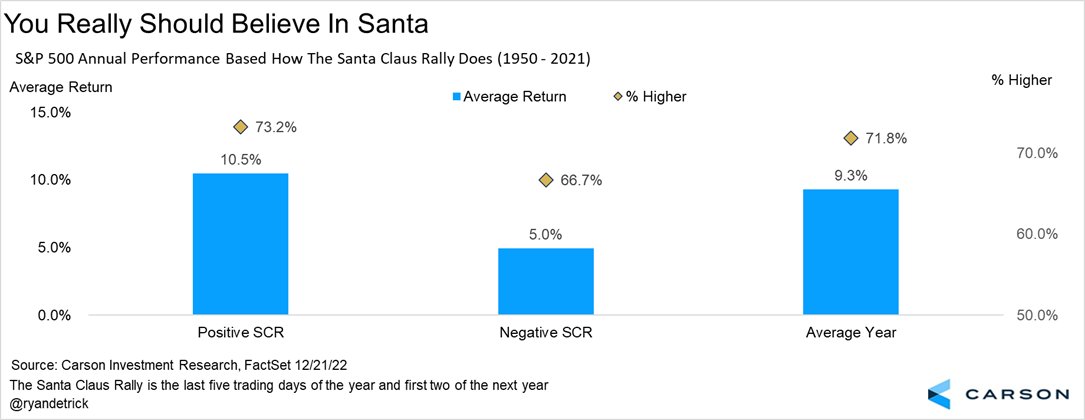
The Santa Clause Rally period begins officially tomorrow and runs into the first two trading sessions of January. Ryan Detrick (of Carson Group) lays out the historical statistics (and what they potentially bode for 2022) here:
(Click on image to enlarge)

Insider Buying. Some helpful data from Jay Kaeppel at Sentiment Trader:

Key Positions Update
As we covered in the media hits above, our focus on the next few years is Emerging Markets (expressed largely with Alibaba and China positions). This is a play on the dollar weakening as the Fed nears the end of the tightening cycle as well as China’s re-opening and stimulus moving forward. Alibaba is best positioned to benefit from the digitization of China (Alicloud) as well as the CCP’s newfound push to domestic consumption (e-commerce) and digital yuan (Ant Financial 1/3 ownership).
The PCAOB has now largely taken de-listing risk off the table with its recent release. Furthermore, the CSRC has effectively green-lighted mainland Chinese investors to begin buying Alibaba for the first time in early 2023.
Alibaba is now up ~51% off its October lows.
Biotech is our second large theme – predicated on M&A deal flows (big pharma has the cash to offset patent cliffs). They will continue to buy growth. Drug approvals have been coming in fast and furious since the focus has shifted from COVID (2020-2021) back to normal innovation (Alzheimer’s, Cancer, etc). A representative basket of Biotech (XBI) is now up ~33% off its May lows.
2022 DEALS:
(Click on image to enlarge)


2022 DRUGS:
(Click on image to enlarge)


Auto Supplier Update
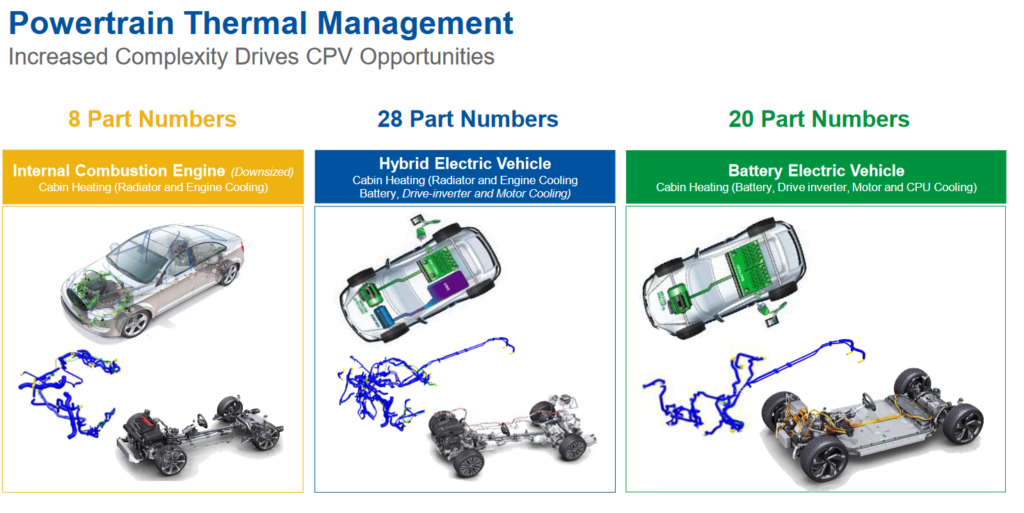
Another of our top three positions is auto-supplier – Cooper Standard. We made our case for the stock several months ago (originally on Fox Business – “The Claman Countdown” June 7, 2022 with Liz Claman) and executed across accounts at ~$5.50 (it is now up ~23% as of yesterday’s close).
On November 15, we got some better than expected news from Cooper Standard when they announced their “Transaction Support Agreement.” They laid out what the new capital structure will look like. You can read the press release here. You can read the full agreement here.
This week (on Monday Evening) CPS issued a press release that the Transaction Support Agreement was moving ahead as outlined with the “Fully Backstopped Private Offering of New First Lien Notes and Private Exchange Offer and Consent Solicitation for Existing Senior Notes as Part of Refinancing Transactions.” Full Cooper Standard SEC Filing (sec). Here are the key points:
(Click on image to enlarge)


1) J.P. Morgan Investment Management Inc. and/or JPMorgan Chase Bank, N.A. and Millstreet Capital Management represent the 62.7% that have already agreed to subscribe. They have also committed to backstop the deal – meaning whatever portion of the remaining 37.3% of bondholders who do not consent or subscribe to the new offering, they will buy the remaining amount of the $580M offered.
2) While this is as close to a “done deal” as you could be (they have all the money and votes they need already committed), it does not formally close until 11:59pm on January 18, 2023.
Let me break down the changes in simple terms. Keep in mind they have a PIK toggle feature on the new debt – so at the company’s option – if they choose they can lower interest expense in the short term and pay it later when global production has recovered. Based on operating improvement and cash on hand, it is not clear they will need/choose to take advantage of that option. We will have greater clarity when the transaction is closed in December.
Long Term Debt (Before Agreement):
| Description | Maturity Date | Terms | Amount Issued |
| Term Loan | November 2, 2023 | Eurodollar + 275 | $340MM |
| Senior Secured Notes | June 1, 2024 | 13% | $250MM |
| Senior Unsecured Notes | November 15, 2026 | 5.625% | $400MM |
| Total LT DEBT Outstanding: | $978MM (Q3 2022) | ||
| TOTAL NET CASH INTEREST EXPENSE: | FY 2021 | $72.5MM |
Long Term Debt (After Completed):
| Description | Maturity Date | Terms | Amount Issued |
| Senior Secured Notes | 2027 | 5.625% (pik toggle option) | $400MM |
| Senior Secured First Lien Notes | 2027 | 13.5% (pik toggle option) | $580MM |
| Total LT DEBT Outstanding: | $980MM (Q1 2023) | ||
| ~MAXIMUM NET CASH INTEREST EXPENSE (without PIK): | FY 2023 | ~$100.8MM |
The good news is, there will likely be no maturities before 2027 – which gives the business plenty of time to recover. The bad news is, the interest expense increases up to ~$28.3MM per year. HOWEVER, IF NEEDED TO THEY CAN PIK TOGGLE FOR THE FIRST TWO YEARS (add to balance and pay less interest). Here’s how that works on the new Senior Secured First Lien Notes:
“The New First Lien Notes will bear interest at the rate of (i) 13.50% per annum, of which no less than 9.00% will be payable in cash and, at the Issuer’s option for the first four interest periods after issuance, the remaining 4.50% may be paid in cash or PIK (or a combination thereof), and (ii) thereafter, 13.50% per annum, payable in cash.”
On the new Senior Secured Notes it will work like this:
“The New Secured Notes will bear interest at the rate of 5.625% cash pay per annum, or at the Issuer’s option for the first four interest periods after issuance, 10.625% in PIK, and thereafter, 5.625% per annum, payable in cash.”
Based on their operational improvement, flow of semiconductors to OEMs, age of fleet (>13.1yrs old) and pent up demand for new cars, I do not think they will have/choose to PIK, but it’s nice that the option will be available in the short term. In this environment, I am amazed they were able to get everything done all at once NOW versus having to manage it over the next year(s). Now they can get back to doing what they do BEST – leading the field in their 3 core categories.
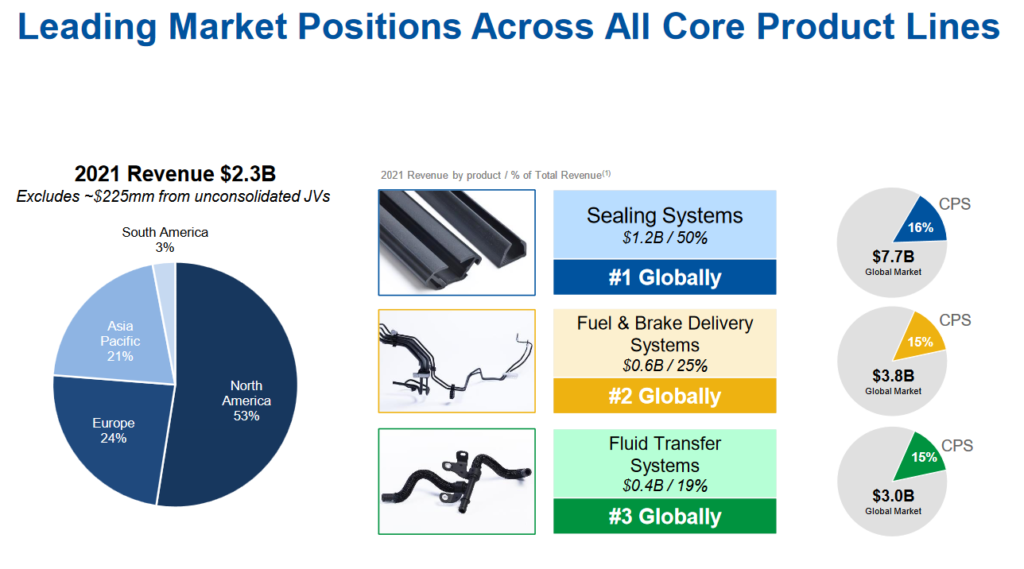
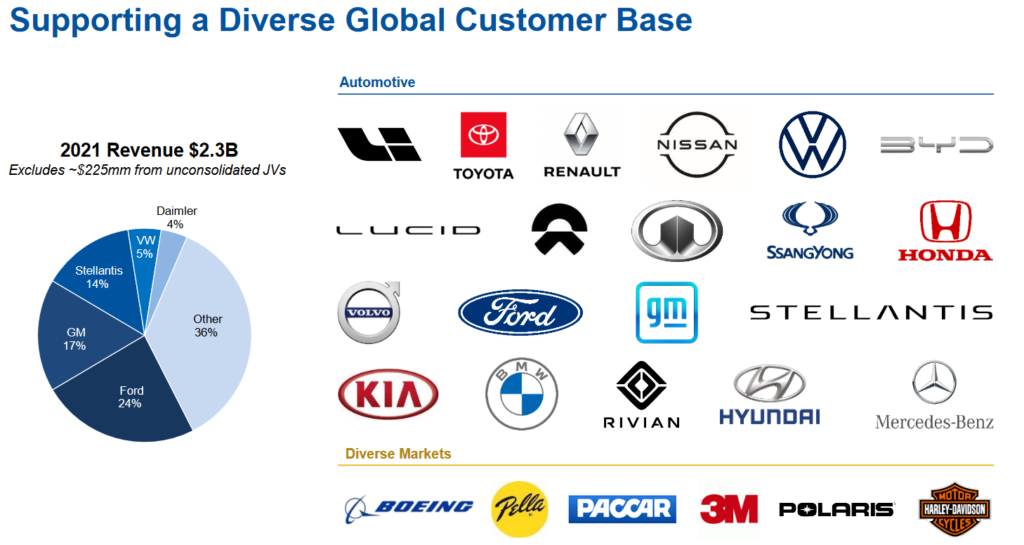
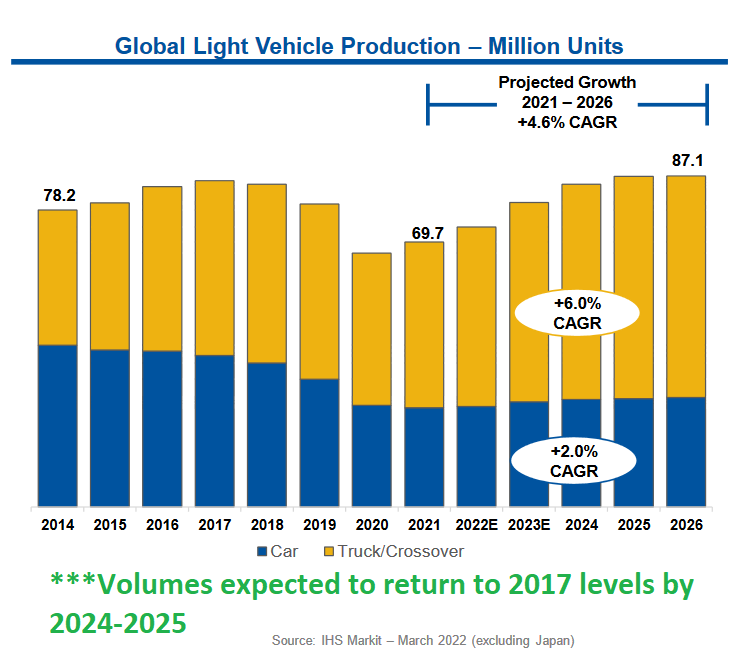
The most important table is the one above with the IHS estimates of Global Light Vehicle production. The key takeaway is that volumes are expected to return to 2017 levels by 2024 or 2025.
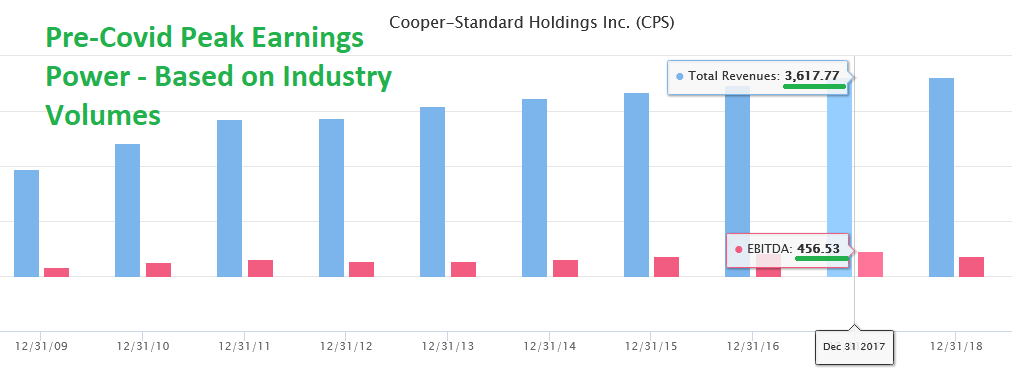
Here’s what Cooper Standard achieved in 2017:
$3.62B Revenues
$452M Adj. EBITDA (12.5% of revs)
$135M Net Income (3.73% of revs) ~18.78M fully diluted shares = ($7.21/share EPS)
Peak stock price on $7.21/share EPS was $146.78 (August 3, 2018) = ~20x P/E multiple.
Here’s what Cooper could achieve in 2024-2025 IF INDUSTRY VOLUMES MEET EXPECTATIONS AND RETURN TO 2017 LEVELS:
$3.3B Revenues (Anti-Vibration unit sold. $320M revenue 2017)
$412M Adj. EBITDA (12.5% of revs)
$123M Net Income (3.73% of revs) ~17.16M fully diluted shares = ($7.19/share EPS).
At 10x P/E = $71.90. At 2017 peak multiple = $146.37. Cut both in half and you’re still at a 5-10x+ bagger.
BUT, you say, EPS will be effected by increased interest expense. THAT IS CORRECT. Interest expense in 2017 was $42M, but TAXES were $74M. While the Interest expense in 2024 or 2025 will be ~$100M (assuming they don’t refinance at lower rates in coming year(s)), keep in mind they have $130MM in Deferred Tax Assets. They will just be moving into profitability and will be able to use a significant portion of that asset to dramatically reduce their cash tax obligation. In effect, it’s possible that EPS in 2024 or 2025 could be a tick higher than 2017 on the same volumes. The key will be what multiple is assigned (peak or trough)?
As I have said numerous times on our podcast|videocast there are 3 key reasons I bought ownership in the company: 1) management respects equity (they have brought share count DOWN over the years), 2) management comp is tied to ROIC (return on invested capital) 3) the operating leverage in this business is unparalleled coming out of industry troughs.
*Past performance is no guarantee of future results. See “terms” above.
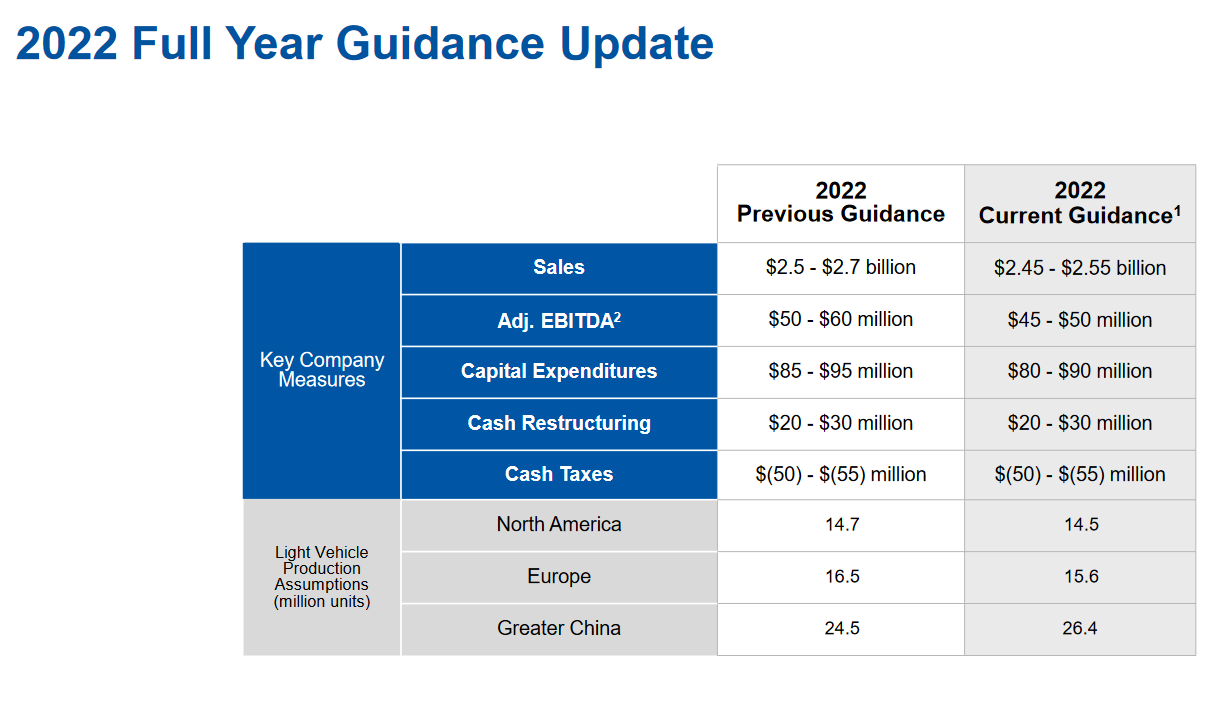
So if it’s such good news, why isn’t the stock up a lot more? While they have the committed backstop investor group for the money and required (majority) vote, the deal still needs to get formally DONE. It has commenced this week (with the required money and votes already on board) and upon completion I would imagine the stock will be materially higher – even before we see the massive operating improvement/leverage kick in in 2023 and beyond.
Here is the short term headwind disclaimer from the press release, which is standard for any financing:

Now onto the shorter term view for the General Market:
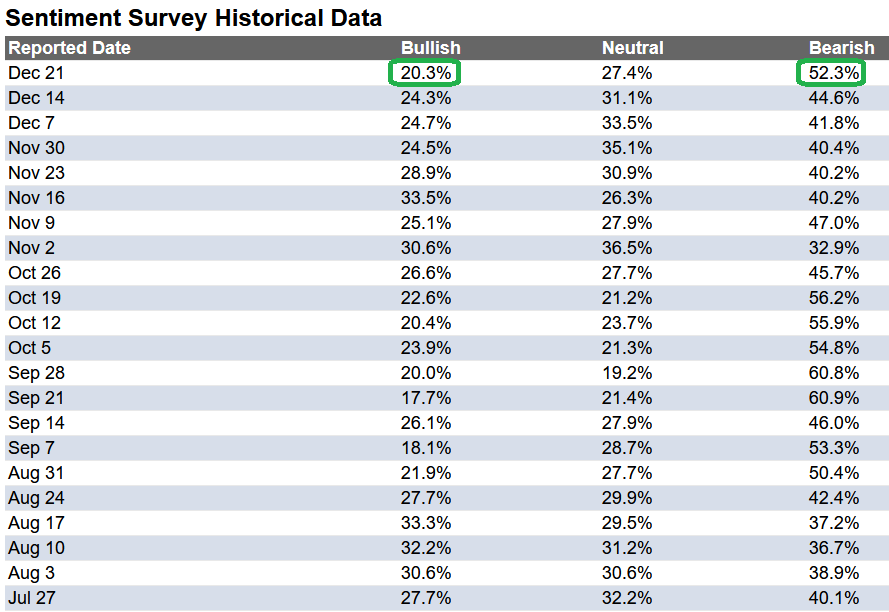
In this week’s AAII Sentiment Survey result, Bullish Percent (Video Explanation) dropped to 20.3% from 24.3% the previous week. Bearish Percent climbed to 52.3% from 44.6%. Sentiment is still despondent for retail traders/investors.
(Click on image to enlarge)
The CNN “Fear and Greed” dropped from 60 last week to 38 this week. Sentiment is fearful. You can learn how this indicator is calculated and how it works here: (Video Explanation)


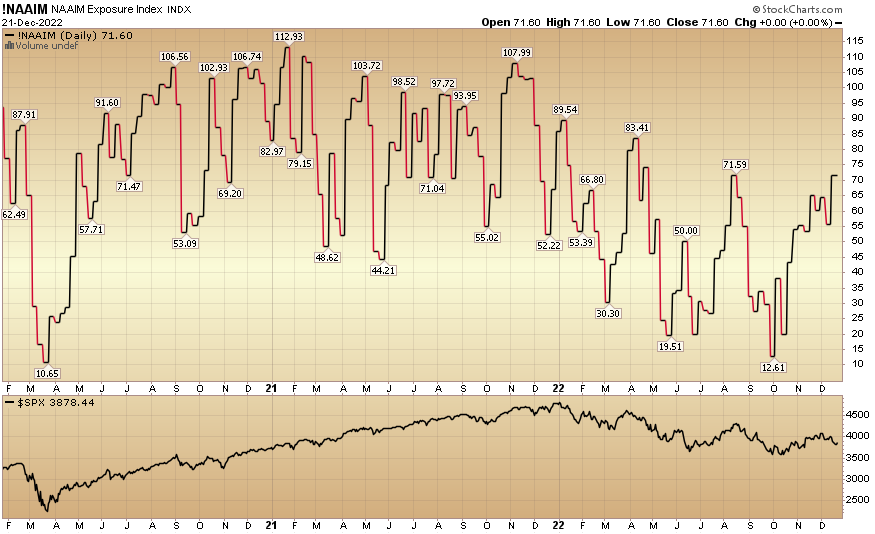
And finally, the NAAIM (National Association of Active Investment Managers Index) (Video Explanation) moved up to 71.60% this week from 55.69% equity exposure last week.
(Click on image to enlarge)
More By This Author:
“Take A Brea(d)th” Stock Market (And Sentiment Results)…
“Buyers’ Strike” Stock Market (And Sentiment Results)…
The “Grinch Has Been Cancelled” Stock Market (And Sentiment Results)
Disclosure: Not investment advice. Visit Terms at HedgeFundTips.com


