Tesla Stock Buying The Dips At The Blue Box Area
Hello fellow traders. In this technical article we’re going to take a quick look at the Elliott Wave charts of Tesla Stock ( $TSLA ) . As our members know, the stock is trading within the cycle from the April 27th low. We have been calling for the rally in the stock after 3 waves pull back. Our team recommended members to avoid selling Tesla , while keep favoring the long side. In the further text we are going to explain the Elliott Wave Forecast and the trading setup.
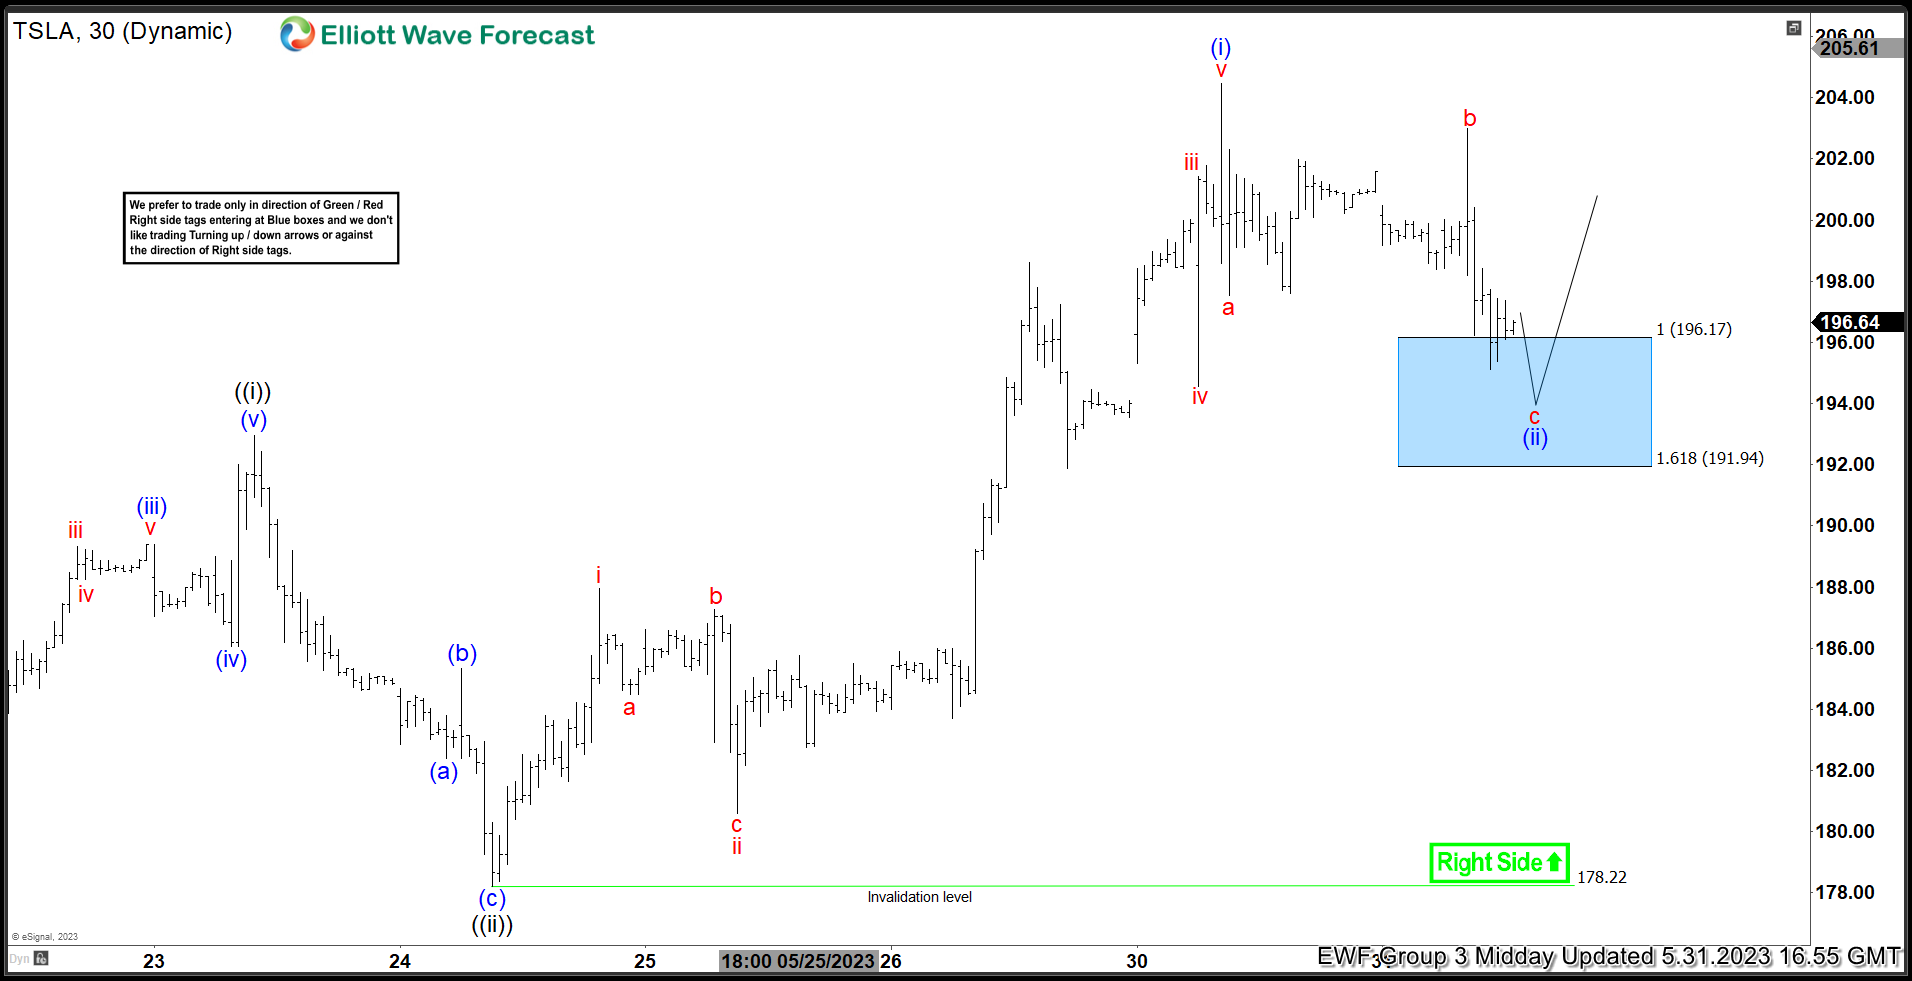
Tesla Stock (TSLA) Elliott Wave 1 Hour Chart 05.31.2023
Current view suggests the stock is doing correction of the cycle from the 178.22 low. We got 5 waves up from the mentioned low wave and now about to complete (ii) blue short term pull back. We can already count 3 waves down from the peak. The price has reached extreme zone at 196.17-191.94 ( blue box- buying zone) . We don’t recommend selling it and prefer the long side. Tesla stock should ideally make a rally toward new highs.
(Click on image to enlarge)
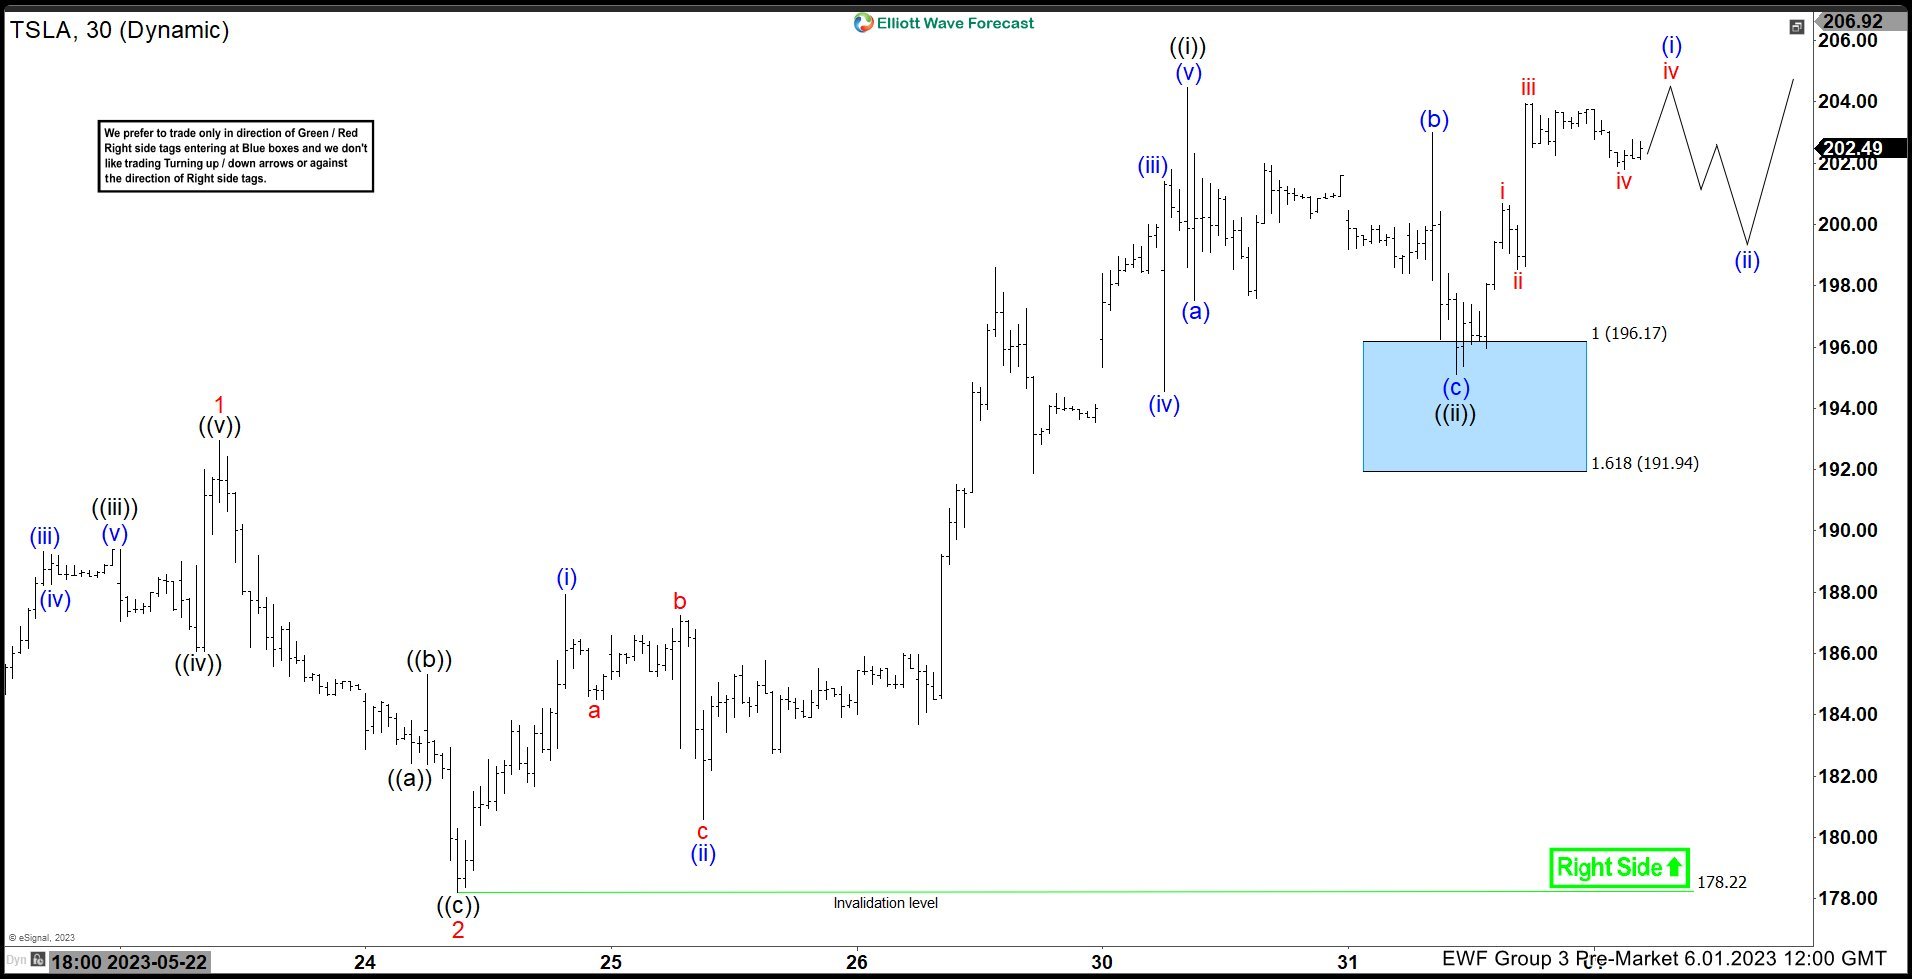
Tesla Stock (TSLA) Elliott Wave 1 Hour Chart 06.01.2023
$TSLA found buyers right at the Blue Box area and we are getting good reaction from there. Rally made enough separation from the lows. As a result, members who took long positions are enjoying profits in a risk free trades. Wave ((ii)) looks completed at 195.17 low . As far as the price holds above that low, the stock can be trading higher in ((iii)) toward new highs. We would like to see break above previous peak ((i)) black which will confirm next leg up is in progress. That would also make 5 waves up in (i) blue. Then we expect to get 3 waves pull back before further rally continues again.
(Click on image to enlarge)
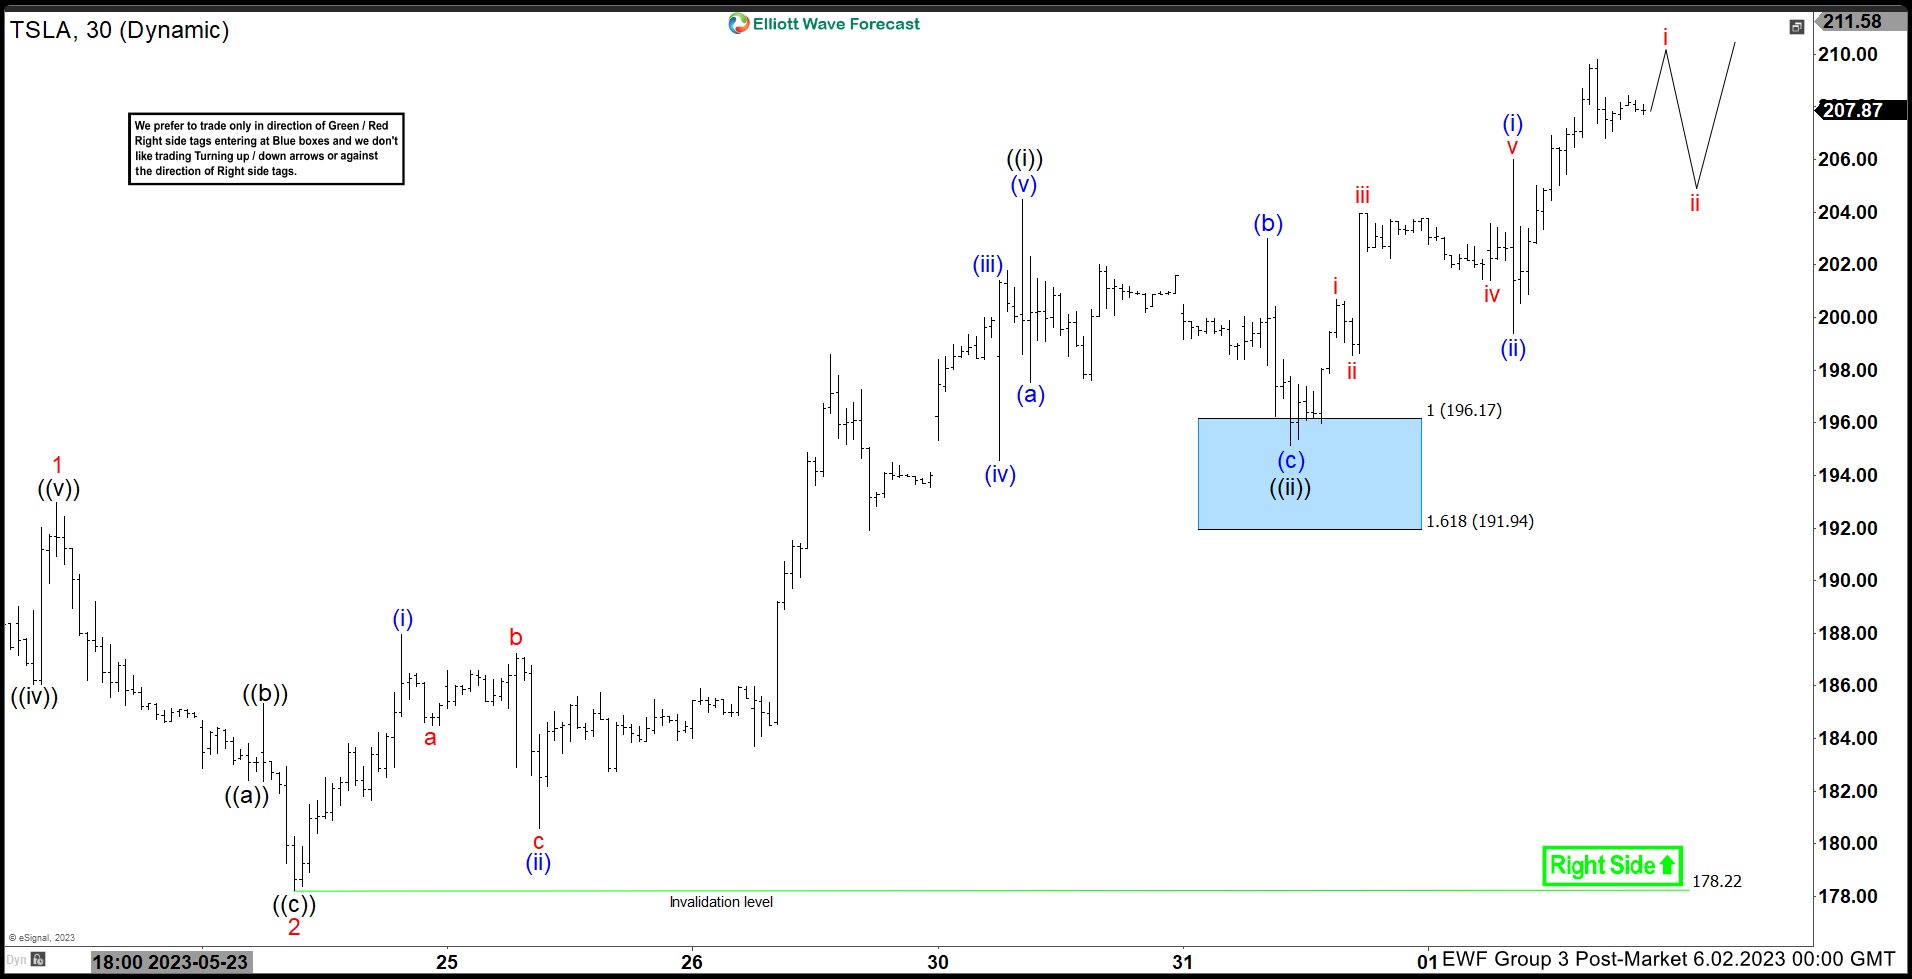
Tesla Stock (TSLA) Elliott Wave 1 Hour Chart 06.02.2023
Eventually the stock made break up as expected. It completed 5 waves up in (i) blue, made pull back in (ii) blue and continued higher again.
Keep in mind that market is dynamic and presented view could have changed in the mean time. You can check most recent charts with target levels in the membership area of the site. Best instruments to trade are those having incomplete bullish or bearish swings sequences. We put them in Sequence Report and best among them are shown in the Live Trading Room
(Click on image to enlarge)
More By This Author:
Nikkei Looking To Complete Wave 5 Of Elliott Wave ImpulsePalantir Technologies Low in Place or More Downside?
Elliott Wave View: USDJPY Approaching Turning Area
Disclaimer: Futures, options, and over the counter foreign exchange products may involve substantial risk and may not be suitable for all investors. Leverage can work against you as well as for ...
more


