

What happens when the CEO of a company decides to take up a hobby and buy another company? The share price of the first company takes a nose-dive. That is what’s happening to shares of Tesla after CEO Elon Musk decided that he would rather obsess over a social media platform (Twitter) than continue to focus his talents and ambitions on the electric vehicle maker. Musk purchased Twitter (TWTR) for $44 billion in October. In addition, he has sold nearly that same value in Tesla shares, which only adds to the downward pressure.
Investors also fear that rising interest rates will lower demand for EVs. Therefore, the industry may be facing a slowdown. Tesla said in October that it may miss its delivery target for the year. On Thursday, it began offering discounts of up to $7,500 on some of its models. Also, on Thursday, Tesla was named in a Senate Inquiry into a possible link to Uyghur forced labor according to the WSJ.
In December alone, the share price of Tesla’s stock has fallen from 197.08 down to 122.26, a drop of over 36%, and there is still 6 trading days left in the month (and year). The share price for Tesla stock is trading at its lowest level since September 2020. On a weekly timeframe, one can see that starting last week, shares of Tesla fell aggressively below the 61.8% Fibonacci level from the pandemic lows in March 2020 to the all-time highs in November 2021, near 172.78. Price is currently testing the bottom, downward sloping channel trendline that the stock has been in since the move from the all-time highs.
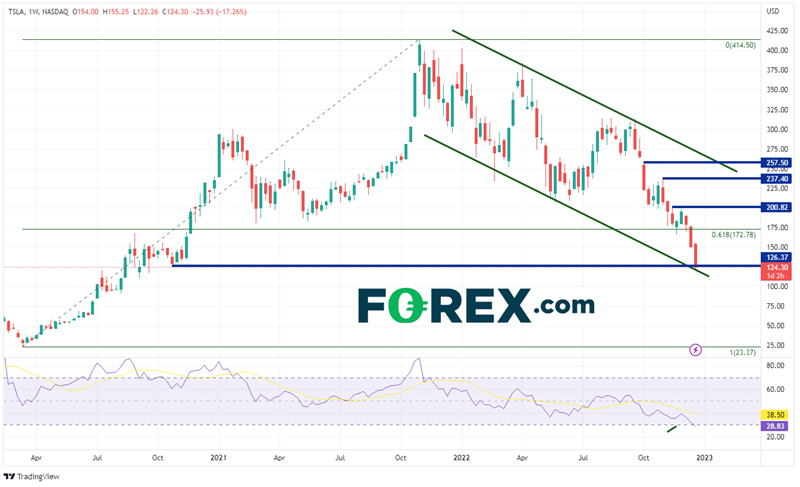
Source: Tradingview, Stone X
Just how bad has the sell-off been? On September 22nd, the stock price traded above 300. More recently, on a daily timeframe, TSLA had formed a descending wedge with price nearing the apex into Thursday. The expectation is that price will break higher out the wedge as price nears the apex. However, price broke lower, below the bottom trendline of the pattern and below the lows of September 2020. If price continues to move lower, the first support level is the bottom trendline of the above-mentioned channel near 118.50. Below there is horizontal support dating to the lows of September 2020 at 109.96, then a gap opening from July 2020 at 84.40. However, notice that the RSI is in oversold territory near 20.33. This is an indication that the stock may be ready for a correction. If the price move proves to be a false breakdown below the descending wedge, the first resistance is at Thursday’s highs of 136.63. Above there, resistance is at the top trendline of the descending wedge near 155.25, then horizontal resistance at 166.19.
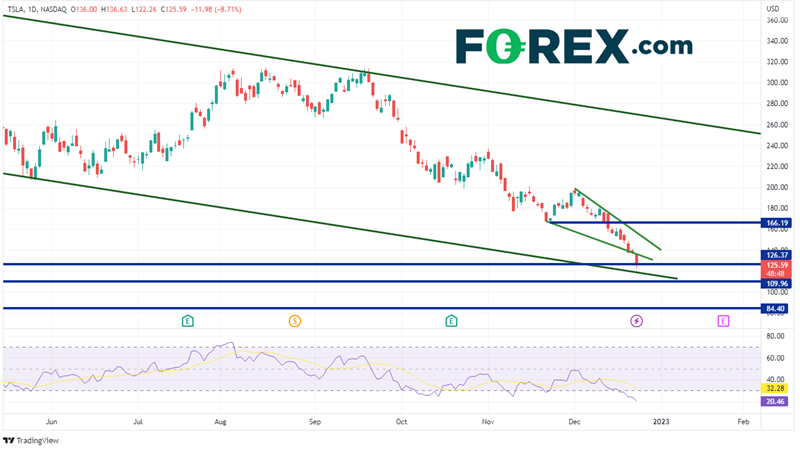
Source: Tradingview, Stone X
Will Telsa shares continue to move lower? Could this be the end-of-year trade that hedge fund managers are piling into along with the rest of the Nasdaq? Maybe. But if Elon Musk names a new Twitter CEO and can pull himself away from his hobby company, maybe he can turn his focus back to Tesla and get the stock price moving higher again!
More By This Author:
Mexico Mid-Month Core Inflation Shows Rate Hikes May Be Starting To Work
Canadian CPI Marginally Higher Than Expected. What Does It Mean For The BoC?
Currency Pair Of The Week: USD/JPY


Comments
Log in or sign up to join the conversation.