Tesla Inc. Reacts Higher From The Blue Box Area.
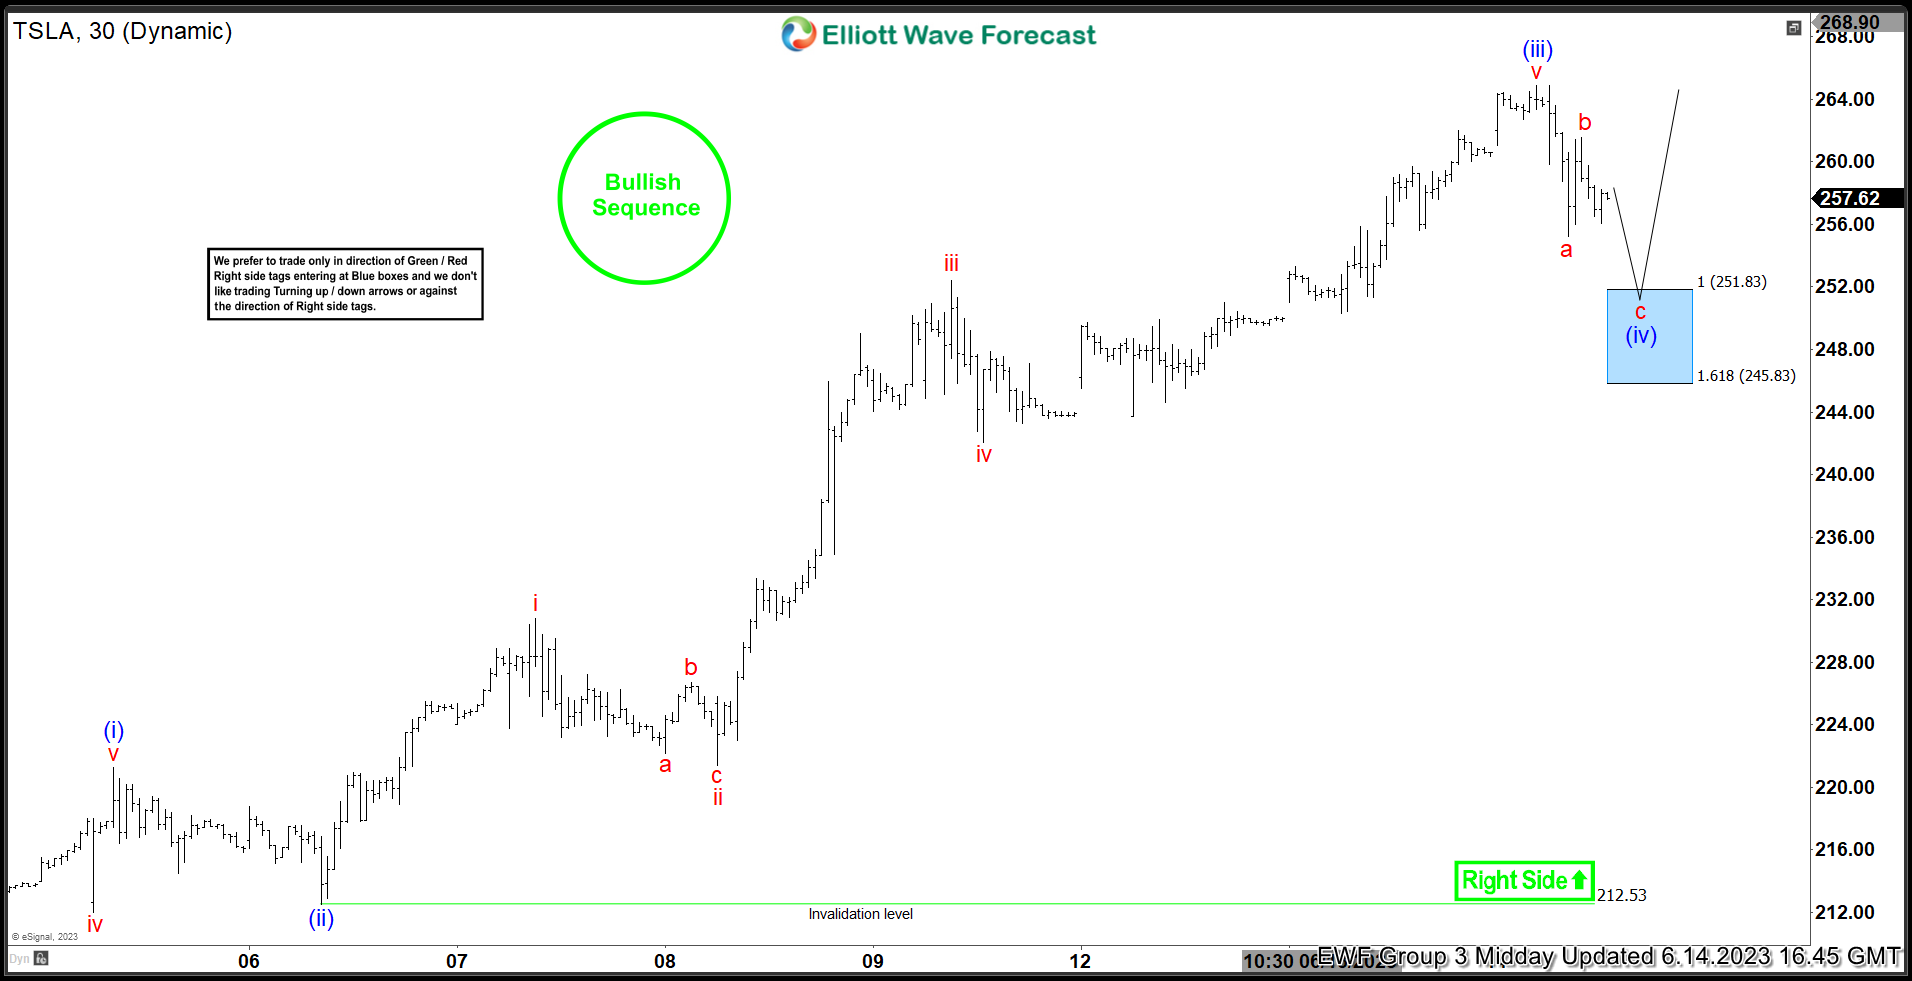
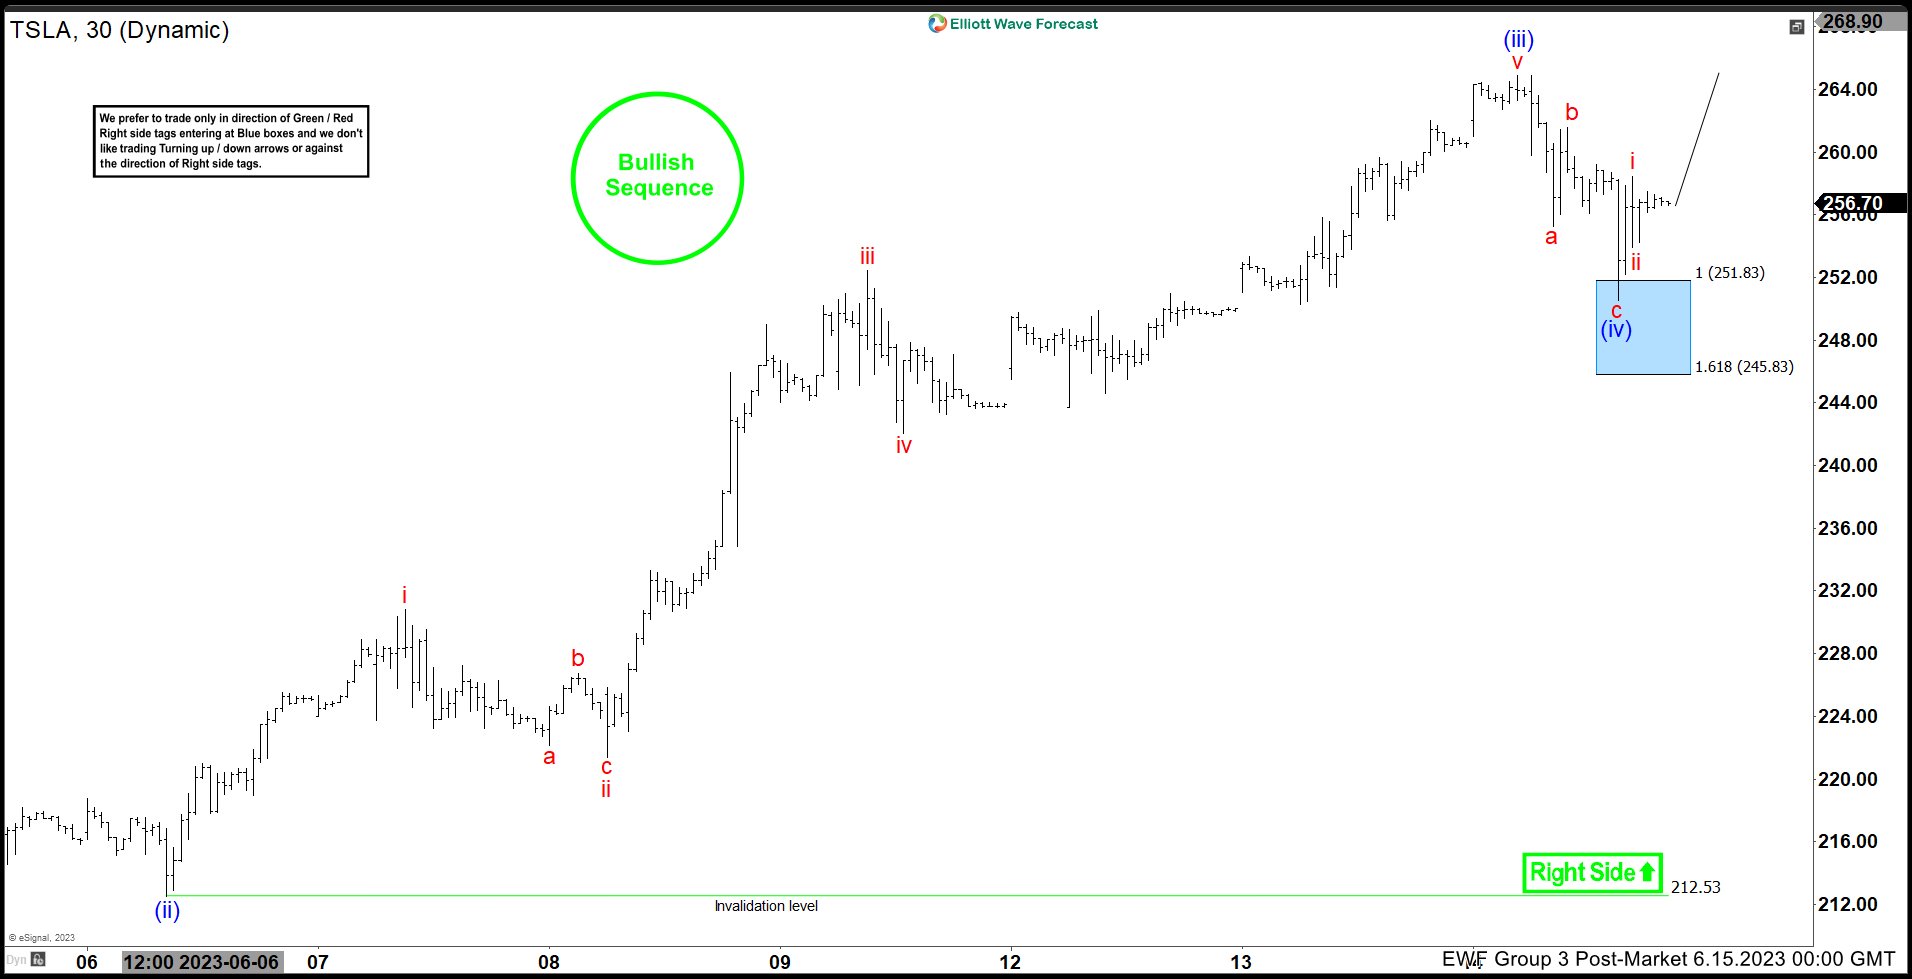
Hello everyone. In today’s article, we will look at the past performance of the 1 Hour Elliott Wave chart of Tesla Inc. (TSLA) The rally from 6.06.2023 low unfolded as a 5 wave impulse with an incomplete bullish sequence from 5.31.2023 low. So, we advised members to buy the pullback in 3 swings at the blue box area ($251.83 – 245.83). We will explain the structure & forecast below:
$TSLA 1H Elliott Wave Chart 6.14.2023:
(Click on image to enlarge)
Here is the 1H Elliott Wave count from 6.14.2023. The rally from 6.06.2023 at (ii) unfolded in a 5 wave impulse which signaled a bullish trend. We expected the pullback to find buyers in 3 swings at $251.83 – 245.83 where we entered as buyers.
$TSLA 1H Elliott Wave Chart 6.15.2023:
(Click on image to enlarge)
Here is the next day 1H update showing the move taking place as expected. The stock has reacted higher ending the cycle from 6.14.2023 peak allowing longs to get a risk free position. We expect more upside towards $270 – 350 area in the near term.
More By This Author:
QQQ Correcting In Wave 4 And Should Find BuyersEthereum Elliott Wave: Forecasting The Path
Is Costco Wholesale Ready For The Next Rally?
Disclaimer: Futures, options, and over the counter foreign exchange products may involve substantial risk and may not be suitable for all investors. Leverage can work against you as well as for ...
more


