Tesla Challenging The Wall

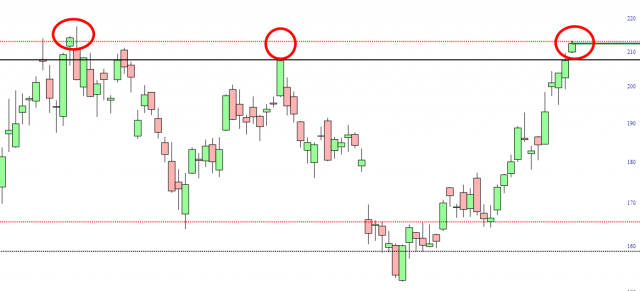
Well, today wins the worst day of the week for me. While I wait out the storm, I’ll share with you the updated chart of Tesla (TSLA) which, like everything else today, is up.
What’s obviously interesting about this is that, over the course of many months, Tesla has challenged this “double Fibonacci” wall and, in the past, has been repelled. So, what’s going right now is a test.
The most important data, beyond the scale of the past few months, is what has taken place over a timespan about three times that big. As with the rest of the market in general, we have a “face-off” situation of a massive mountain range of overhead supply (on the left) and a burgeoning base (on the right).
I have no position in Tesla, but my supposition here is that if TSLA manages to conquer this double wall, sure, it could push even higher, but I think the ease with which it traversed the past few months is incomparable to what would like ahead, considering just how much overhead supply there is.
That is to say, there are plenty of folks who bought in that magenta zone who have been dying to get out at a profit – even a tiny one – and will take their first opportunity to do so.
Of course, if we fall out at this level, then we could simply slip right back down into this sinewave-like cycle and simply grind lower for weeks to come.
More By This Author:
Strong Jobs, Strong MarketLoopy Lemon
Memorial Weekend ETFs: The Core


