

Image Source: Unsplash
TeraWulf (WULF) has been a popular stock of late for traders, showing significant volatility that presents both opportunities and risks. Recently, the stock has seen a notable struggle between support and resistance, leaving traders unsure whether the bulls or bears currently have the edge. By examining the chart, we can gain a clearer understanding of the key levels and potential scenarios that could unfold.
This technical analysis explores the current state of WULF’s chart, identifies the critical support and resistance zones driving price action, and outlines both bullish and bearish scenarios. Understanding these levels is essential for traders looking to make informed decisions in a volatile environment.
WULF Chart Analysis
Let’s look at the daily chart for WULF to see what the price action is telling us.
(Click on image to enlarge)
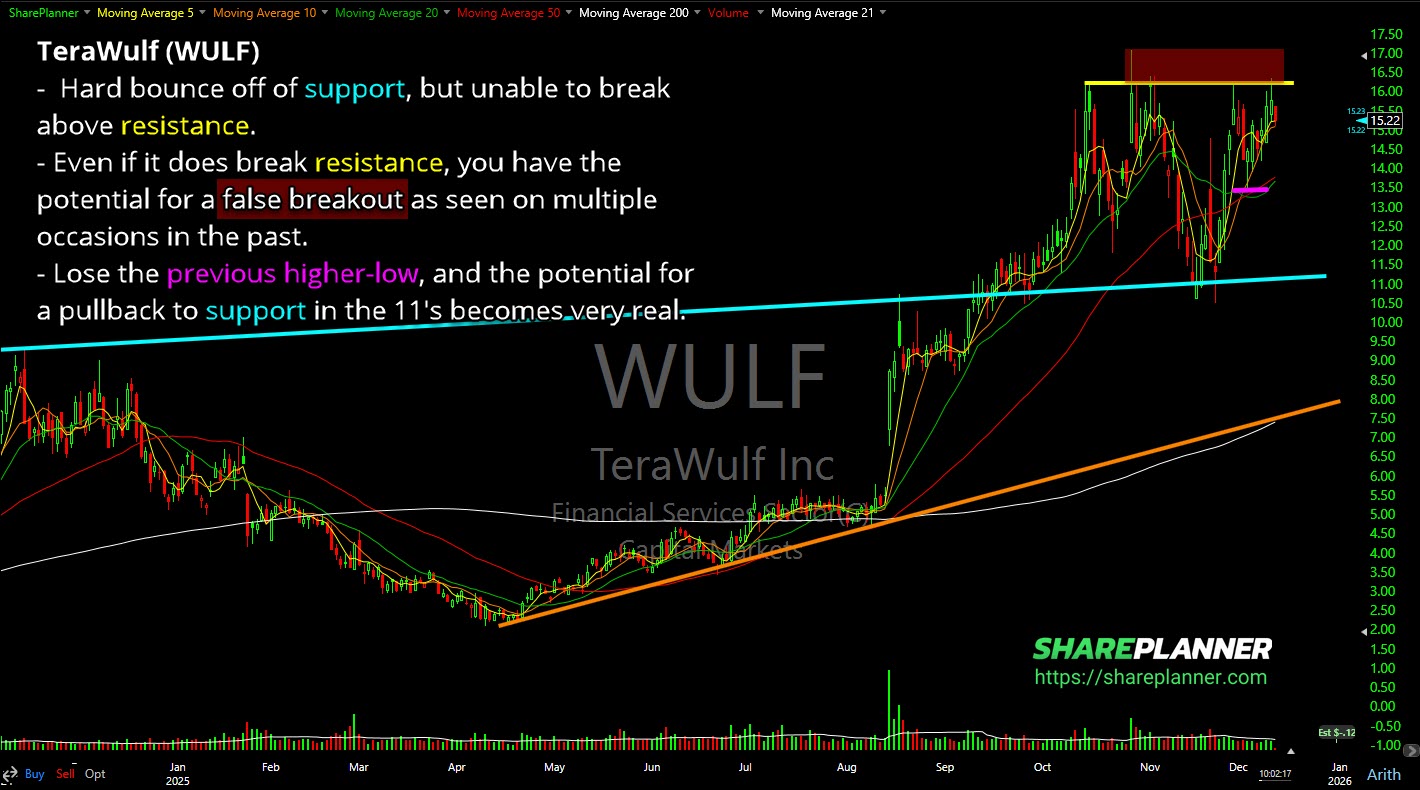
The most immediate observation is the strong bounce WULF experienced off a key support level. This is a positive sign, as it shows buyers stepping in to defend this price zone. However, the stock has so far been unable to break through overhead resistance. This creates a state of indecision, where neither the bulls nor the bears have full control.
For a bullish case to develop, WULF needs to decisively break above resistance. A confirmed breakout would signal that buyers have absorbed selling pressure and could pave the way for further upside.
The Risk of a False Breakout
Even if WULF manages to push above its current resistance, traders should remain cautious.
The chart shows a history of false breakouts at resistance. On multiple occasions, the stock has briefly moved above resistance only to quickly reverse lower. This type of price action is often referred to as a bull trap, where buyers are lured in before the stock rolls over.
Here is what to watch for to avoid getting caught in a false breakout:
- Confirmation: Do not trade the initial breakout alone. Look for confirmation, such as a daily close above resistance or a successful retest of resistance as new support.
- Volume: Strong breakouts are usually accompanied by expanding volume. A breakout on low volume is a warning sign that buyers may lack conviction.
Given WULF’s recent behavior, patience is key. Waiting for confirmation can help avoid unnecessary losses if a breakout fails to hold.
Bearish Scenario: Watching the Higher Lows
On the bearish side, the most important level to monitor is the most recent higher low. In a healthy uptrend, pullbacks should consistently form higher lows.
If WULF breaks below its most recent higher low, it would be a meaningful sign of weakness. Such a move would invalidate the current uptrend structure and suggest sellers are gaining control. In this scenario, a deeper pullback becomes increasingly likely, with a potential move back toward major support near the $11 area.
Navigating WULF’s Next Move
The technical picture for TeraWulf is at a critical juncture. The stock is caught between firm support and stubborn resistance, making the next directional move uncertain. A confirmed breakout could lead to further upside, but the history of false breakouts warrants caution. On the other hand, a break below the recent higher low would be a bearish signal that could trigger a larger correction.
By focusing on key levels and waiting for confirmation, traders can stay objective and react to WULF’s next major move rather than guessing its direction.
More By This Author:
ORCL Stock Analysis – Earnings Pullback & Bounce StrategyNBIS Stock Analysis – Sell‑Off, Bounce Potential & Next Move
FOMC Statement


Comments
Log in or sign up to join the conversation.