
Technical Tuesday: Stuck In The Middle With You

Welcome to the inaugural edition of "Technical Tuesdays."
If it's Tuesday, it's time to focus on the trend and momentum of the market. We start each week with a review of the primary market cycles through the lens of our big-picture primary cycle models. Next, I like to review the market's trend and momentum via our indicator boards and running through some charts.
The theme to this week's technical review can be summed up with the refrain from the Stealers Wheel's hit from 1972, "Stuck In The Middle With You" as the major indices have been moving sideways for more than a month now. But in order to avoid becoming complacent, let's take a look at the state of our trend and momentum indicators.
The State of the Trend Indicators
The Trend board indicators are designed to determine the overall technical health of the current stock market trend in terms of the short- and intermediate-term time frames.
The trend board has seen some deterioration over the past week as the major indices remain stuck in a sideways trading range. While there are two sell signals on the trend board here, we will place more emphasis on the bounds of the trading range than any moving averages at this time. In other words, the real key here is which way the indices break out of the range.
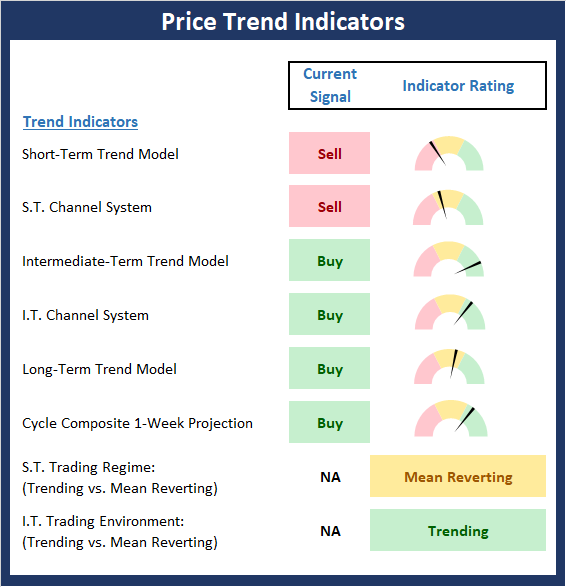
* Source: Ned Davis Research (NDR) as of the date of publication. Historical returns are hypothetical average annual performances calculated by NDR. Past performances do not guarantee future results or profitability - NOT INDIVIDUAL INVESTMENT ADVICE.
My Take on the State of the Charts
While the Nasdaq 100 (second chart below) has roared higher and remains in a solid uptrend, the rest of the major indices remain range bound in a consolidation phase (between 2965 on the downside and 3230 on the upside of the S&P 500). This is very clear on the chart of the S&P 500 below. Thus, traders and investors everywhere will be watching to see which way price breaks out of the current trading range - and movements within the range should be taken with a grain of salt.
S&P 500 - Daily

Looking at the NDX, which has been the clear leader for many moons, it is clear that these market darlings are due to rest for a while. As such, some underperformance in the near-term is to be expected. However, as long as the NDX does not put in a "lower low" on the chart (which I'll define as a couple closes below 9850), I will continue to give the bulls the benefit of the doubt.
Nasdaq 100 - Daily

The State of Market Momentum
Once we've reviewed the state of the tape, we then analyze the internals to determine if there is any "oomph" behind the current trend via our group of market momentum indicators/models.
The Momentum Board has taken a pretty good hit of late. Last week, I rated the state of market momentum as moderately positive. This week, I think it has to be downgraded to neutral. However, the indicators that have dipped into the red are fairly active and would flip back to positive with a few decent up days.
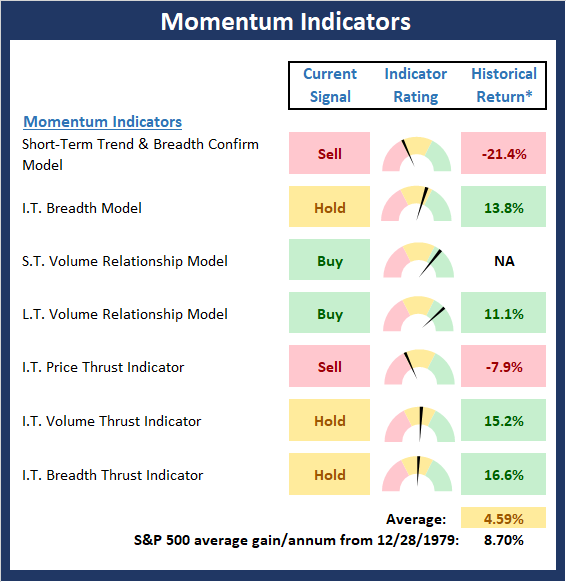
* Source: Ned Davis Research (NDR) as of the date of publication. Historical returns are hypothetical average annual performances calculated by NDR. Past performances do not guarantee future results or profitability - NOT INDIVIDUAL INVESTMENT ADVICE.
The Bottom Line
Although some weakness has crept into the indicator boards and the major indices have been doing a lot of nothing - albeit in an oftentimes volatile fashion, I think it is important to remember markets tend to exit a trading range heading in the same direction they were before the range began. As such, my plan is to stay seated on the bull train until/unless the trend/momentum indicators suggest otherwise.
Disclosure: At the time of publication, Mr. Moenning held long positions in the following securities mentioned: none - Note that positions may change at any time.
The opinions and forecasts ...
more

