
The good news is:
- Seasonality improves after next week.
The Negatives
The first chart covers the last 6 months showing the S&P 500 (SPX) in red and a 10% trend (19 day EMA) of NYSE new highs (NY NH) in green. Dashed vertical lines have been drawn on the 1st trading day of each month.
NY NH is declining with prices.

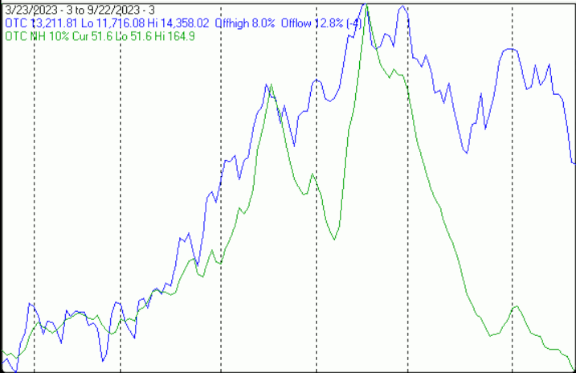
The next chart is similar to the one above except it shows the Nasdaq composite (OTC) in blue and OTC NH, in green, has been calculated with Nasdaq data.
OTC NH fell to a new low for the past 6 months.
Summation indices are running totals of oscillator values.
Short term momentum indicators applied to summation indices make them nearly binary so direction is less important than position.
The next chart covers the past 6 months showing the SPX in red and momentum of summation indices of oscillators of advancing and declining issues, new highs and new lows and upside and downside volume on the NYSE.
NYSE SI’s are all near their lows.

The next chart is similar to the one above, except it shows the OTC, in blue, as the index and the SI’s have been generated from Nasdaq breadth data.
Nasdaq SI’s are all at or near the bottom.

The next chart covers the last 6 months showing the OTC in blue and a 10% trend (19 day EMA) of Nasdaq new lows (OTC NL) in brown. OTC NL has been plotted on an inverted Y axis so decreasing numbers of new lows move the indicator upward (up is good).
OTC NL led prices sharply downward.

The next chart is similar to the one above except it shows the SPX in red and NY NL, in blue, has been calculated with NYSE data.
Ditto NY NL.

The next chart covers the past 6 months showing the OTC in blue and a 40% trend (4 day EMA) of Nasdaq new highs divided by new highs + new lows (OTC HL Ratio), in red. Dashed horizontal lines have been drawn at 10% levels for the indicator; the line is solid at the 50%, neutral level (equal numbers of new highs and new lows).
OTC HL Ratio fell to an extreme negative value.

The next chart is similar to the one above except it shows the SPX in red and NY HL ratio, in blue, has been calculated with NYSE data.
NY HL ratio followed prices sharply downward.

The Positives
The market is oversold and Seasonality improves after this week.
Seasonality
Next week includes the last 5 trading days of September during the 3rd year of the Presidential Cycle. The tables below show the daily change, on a percentage basis for that period.
OTC data covers the period from 1963 to 2022 while SPX data runs from 1928 to 2022. There are summaries for both the 3rd year of the Presidential Cycle and all years combined.
Average returns for the coming week have been negative by all measures.
Report for the last 5 days of September.

The number following the year represents its position in the Presidential Cycle.

The number following the daily return represents the day of the week; 1 = Monday, 2 = Tuesday etc.


OTC Presidential Year 3 (PY3)

               Day5      Day4      Day3      Day2      Day1      Totals

 1963-3      -0.37% 2  -0.34% 3  -0.71% 4  -0.49% 5  -0.23% 1    -2.13%

 1967-3       0.19% 1   0.18% 2  -0.32% 3   0.18% 4   0.08% 5     0.31%

 1971-3       0.07% 5  -0.64% 1   0.18% 2   0.20% 3   0.40% 4     0.21%

 1975-3       0.65% 3  -0.43% 4   0.05% 5  -1.01% 1  -1.38% 2    -2.13%

 1979-3      -0.35% 1  -0.57% 2   0.41% 3   0.33% 4  -0.26% 5    -0.44%


 Avg          0.04%    -0.36%    -0.08%    -0.16%    -0.28%      -0.83%


 1983-3       0.05% 1  -0.98% 2  -0.34% 3  -0.16% 4  -0.88% 5    -2.31%

 1987-3       0.12% 4   0.15% 5   0.09% 1  -0.10% 2   0.55% 3     0.81%

 1991-3       0.34% 2   0.26% 3  -0.17% 4  -0.47% 5   0.46% 1     0.42%

 1995-3      -0.68% 1  -0.77% 2  -1.12% 3   2.00% 4  -0.34% 5    -0.92%

 1999-3      -0.34% 5   0.78% 1  -0.20% 2  -0.94% 3   0.58% 4    -0.12%


 Avg         -0.10%    -0.12%    -0.35%     0.07%     0.07%      -0.42%


 2003-3      -2.00% 3  -1.44% 4  -1.39% 5   1.81% 1  -2.00% 2    -5.01%

 2007-3      -0.12% 1   0.58% 2   0.58% 3   0.39% 4  -0.30% 5     1.13%

 2011-3       1.35% 1   1.20% 2  -2.00% 3  -0.43% 4  -2.00% 5    -1.89%

 2015-3      -0.38% 4  -1.01% 5  -2.00% 1  -0.59% 2   2.00% 3    -1.98%

 2019-3      -1.46% 2   1.05% 3  -0.58% 4  -1.13% 5   0.75% 1    -1.38%


 Avg         -0.52%     0.08%    -1.08%     0.01%    -0.31%      -1.83%


OTC summary for PY3 1963 - 2019

Averages     -0.20%    -0.13%    -0.50%    -0.03%    -0.17%      -1.03%

% Winners       47%       47%       33%       40%       47%         33%

MDD  9/30/2003  4.96% --  9/30/2011  4.38% --  9/29/2015  3.93%


OTC summary for all years 1963 - 2022

Averages     -0.10%    -0.02%    -0.11%    -0.08%    -0.04%      -0.35%

% Winners       53%       53%       48%       42%       48%         48%

MDD 9/30/1974  6.17% --  9/30/2003  4.96% --  9/27/1990  4.54%

SPX PY3

               Day5      Day4      Day3      Day2      Day1      Totals

 1931-3       2.00% 5  -1.74% 6  -2.00% 1  -2.00% 2  -2.00% 3    -5.74%

 1935-3       0.43% 3   0.00% 4  -0.26% 5   0.09% 6   0.17% 1     0.43%

 1939-3       1.24% 2   0.00% 3  -1.91% 4  -0.54% 5   1.80% 6     0.58%


 1943-3      -0.08% 6  -0.74% 1  -0.17% 2   0.25% 3   0.58% 4    -0.16%

 1947-3       0.40% 3  -0.60% 4  -0.34% 5   0.61% 1   1.14% 2     1.21%

 1951-3      -0.43% 1   0.34% 2   0.09% 3  -0.56% 4  -0.04% 5    -0.60%

 1955-3      -2.00% 1   2.00% 2   1.68% 3  -0.63% 4  -0.82% 5     0.23%

 1959-3       1.72% 4  -0.09% 5   0.74% 1   0.63% 2  -1.10% 3     1.91%


 Avg         -0.08%     0.18%     0.40%     0.06%    -0.05%       0.52%


 1963-3       0.47% 2  -0.56% 3  -0.85% 4  -0.19% 5  -0.60% 1    -1.73%

 1967-3       0.61% 1  -0.85% 2   0.03% 3   0.00% 4  -0.08% 5    -0.29%

 1971-3      -0.23% 5  -0.54% 1   0.27% 2   0.02% 3   0.45% 4    -0.04%

 1975-3       0.94% 3  -0.12% 4   0.64% 5  -1.35% 1  -1.36% 2    -1.24%

 1979-3      -0.78% 1   0.06% 2   0.26% 3   0.23% 4  -0.81% 5    -1.04%


 Avg          0.20%    -0.40%     0.07%    -0.26%    -0.48%      -0.87%


 1983-3       0.33% 1  -0.96% 2  -0.25% 3  -0.46% 4  -0.69% 5    -2.04%

 1987-3      -0.46% 4   0.14% 5   0.95% 1  -0.47% 2   0.04% 3     0.21%

 1991-3       0.46% 2  -0.21% 3  -0.10% 4  -0.15% 5   0.51% 1     0.50%

 1995-3       0.01% 1  -0.07% 2  -0.06% 3   0.83% 4  -0.25% 5     0.46%

 1999-3      -0.27% 5   0.46% 1  -0.09% 2  -1.08% 3   1.13% 4     0.16%


 Avg          0.02%    -0.13%     0.09%    -0.27%     0.15%      -0.14%


 2003-3      -1.91% 3  -0.61% 4  -0.64% 5   0.98% 1  -1.05% 2    -3.23%

 2007-3      -0.53% 1  -0.03% 2   0.54% 3   0.39% 4  -0.30% 5     0.07%

 2011-3       2.00% 1   1.07% 2  -2.00% 3   0.81% 4  -2.00% 5    -0.12%

 2015-3      -0.34% 4  -0.05% 5  -2.00% 1   0.12% 2   1.91% 3    -0.35%

 2019-3      -0.84% 2   0.62% 3  -0.24% 4  -0.53% 5   0.50% 1    -0.50%


 Avg         -0.32%     0.20%    -0.87%     0.35%    -0.19%      -0.83%


SPX summary for PY3 1931 - 2019

Averages      0.12%    -0.11%    -0.25%    -0.13%    -0.12%      -0.49%

% Winners       52%       30%       39%       48%       43%         43%

MDD  9/30/1931  7.52% --  9/30/2003  3.21% --  9/30/2011  3.18%


SPX summary for all years 1928 - 2022

Averages     -0.12%    -0.09%     0.05%    -0.12%    -0.03%      -0.31%

% Winners       46%       46%       57%       52%       46%         52%

MDD 9/30/1974  8.04% --  9/30/1931  7.52% --  9/30/1930  7.34%
Conclusion
The market is doing its late September seasonal sell off.
The breadth indicators all have a negative bias.
The market is oversold and Seasonality remains negative for another week.
The strongest sectors last week were Utilities and Precious metals (for the second week in a row) while the weakest were Banks and Electronics.
I expect the major averages to be lower on Friday September 29 than they were on Friday September 22.
More By This Author:
Technical Market Report For September 16, 2023
Technical Market Report For September 9, 2023
Technical Market Report For September 2, 2023


Comments
Log in or sign up to join the conversation.