

The good news is:
- The market is oversold as we enter a seasonally strong period.
The Negatives
The first chart covers the last 6 months showing the Nasdaq composite (OTC) in blue and a 10% trend (19 day EMA) of Nasdaq new highs (OTC NH) in green. Dashed vertical lines have been drawn on the 1st trading day of each month.
OTC NH continued to decline.
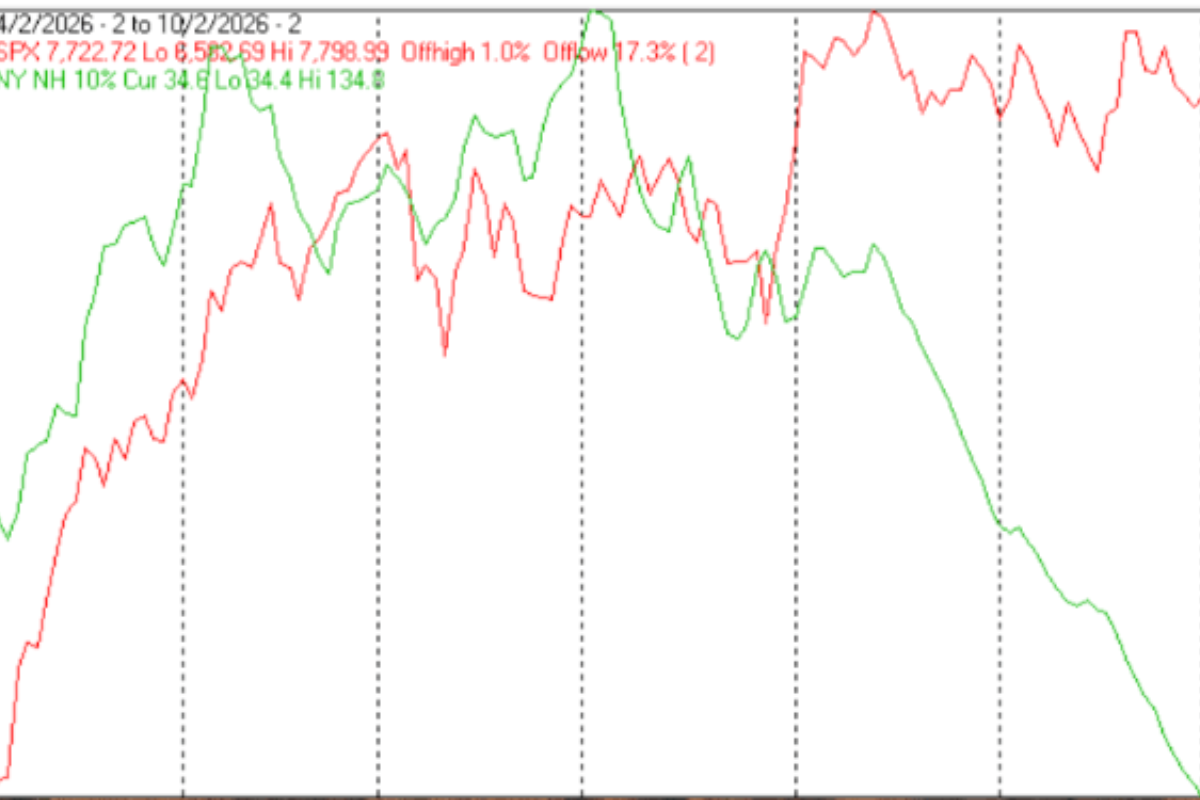
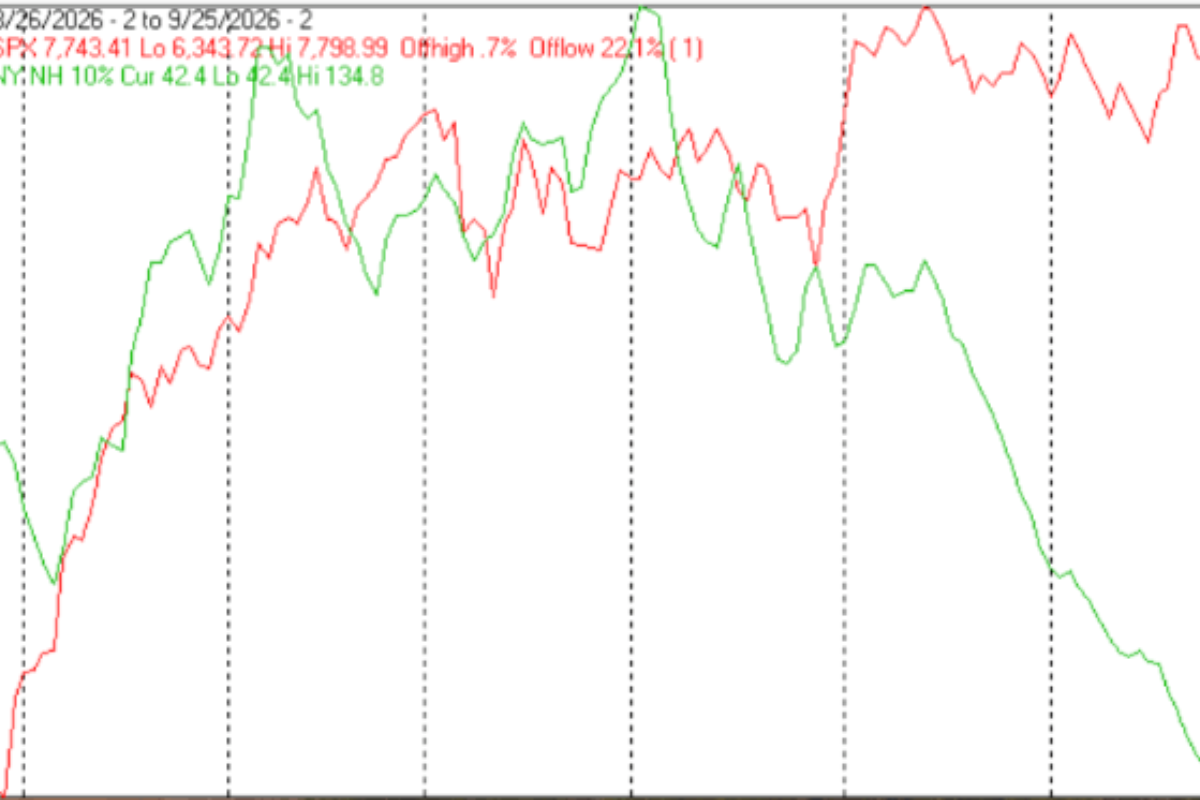
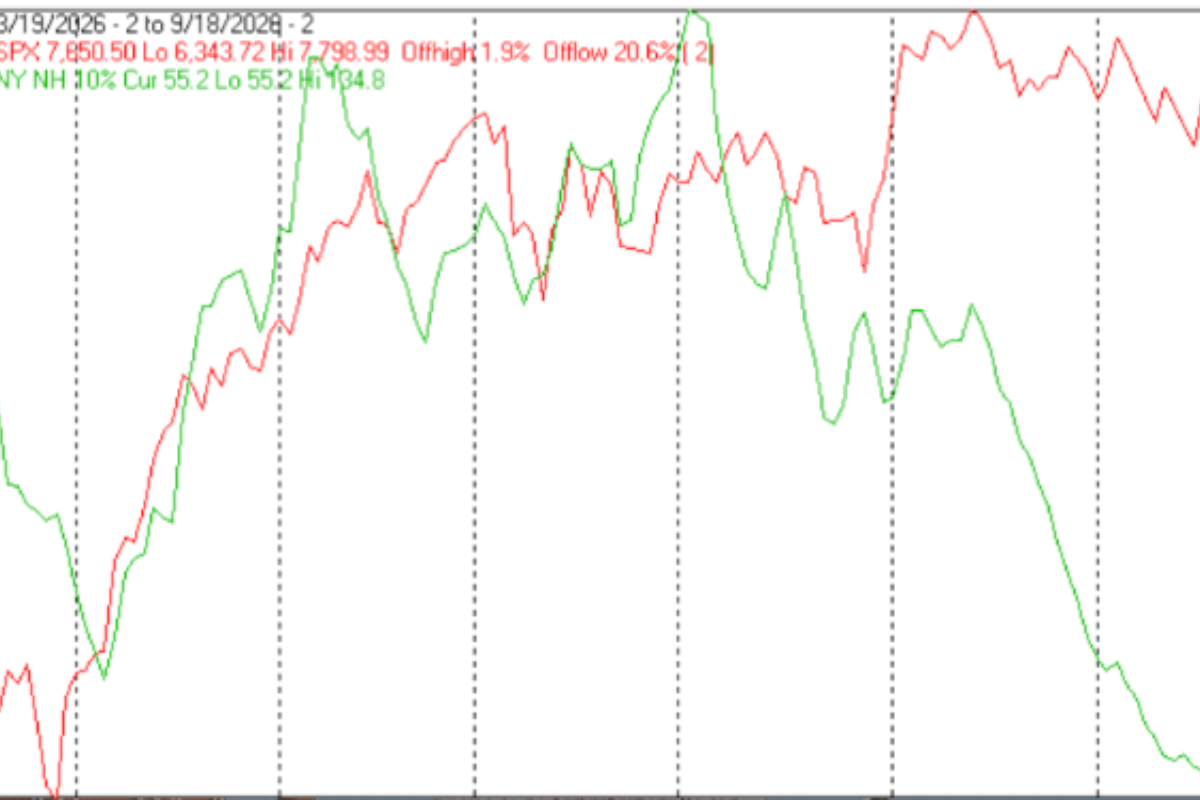
The next chart is similar to the one above except it shows the S&P 500 (SPX) in red and NY NH in green has been calculated with NYSE data.
NY NH resumed its tumble.
The next chart covers the past 6 months showing the SPX in red and a 10% trend (19 day EMA) of NYSE new lows (NY NL) in blue. NY NL has been plotted on an inverted Y axis so decreasing numbers of new lows move the indicator upward (up is good).
NY NL fell sharply.
The next chart is similar to the one above except it shows the OTC in blue, and OTC NL, in brown, has been calculated with Nasdaq data.
OTC NL also had a bad week.
The next chart covers the past 6 months showing the OTC in blue and a 40% trend (4 day EMA) of Nasdaq new highs divided by new highs + new lows (OTC HL Ratio), in red. Dashed horizontal lines have been drawn at 10% levels for the indicator; the line is solid at the 50%, neutral level (equal numbers of new highs and new lows).
OTC HL Ratio fell into deeply negative territory.
The next chart is similar to the one above except it shows the SPX in red and NY HL ratio, in blue, has been calculated with NYSE data.
NY HL Ratio fell into seriously negative territory.
The Positives
The market is oversold and next week is both a holiday week and the last 4 trading days of the month.
Seasonality
Next week next week is a holiday week that includes the last 4 trading of November during the 1st year of the Presidential Cycle. There are 2 sets of tables showing both perspectives.
OTC data covers the period from 1963 to 2024 while SPX data, in the Thanksgiving table runs from 1953 to 2024 and the end of month table runs from 1928 to 2024. There are summaries for both the 1st year of the Presidential Cycle and all years combined. Prior to 1953 the market traded 6 days a week so in the Thanksgiving table that data has been ignored.
Seasonality for the coming week has been weaker during the 1st year of the Presidential Cycle than other years.
Report for the 3 days before Thanksgiving and 1 day after. (Day1 = the day after)
The number following the year represents its position in the Presidential Cycle. The number following the daily return represents the day of the week;
1 = Monday, 2 = Tuesday etc.
OTC Presidential Year 1 PY1
Day4 Day3 Day2 Day1 Totals
1965-1 -0.09% 1 0.04% 2 -0.02% 3 0.47% 5 0.40%
1969-1 -0.55% 1 -1.24% 2 0.05% 3 -0.11% 5 -1.86%
1973-1 -2.35% 1 0.00% 2 -2.44% 3 0.77% 5 -4.03%
1977-1 0.13% 1 0.57% 2 0.79% 3 0.57% 5 2.05%
1981-1 -0.30% 1 0.52% 2 0.49% 3 0.50% 5 1.22%
Avg -0.63% -0.02% -0.23% 0.44% -0.44%
1985-1 -0.33% 1 0.24% 2 0.81% 3 0.30% 5 1.01%
1989-1 -0.22% 1 -0.34% 2 0.22% 3 0.33% 5 -0.02%
1993-1 -1.79% 1 1.18% 2 0.85% 3 0.22% 5 0.47%
1997-1 -2.09% 1 0.13% 2 0.35% 3 0.38% 5 -1.23%
2001-1 1.89% 1 -2.79% 2 -0.29% 3 1.50% 5 0.31%
Avg -0.51% -0.32% 0.39% 0.55% 0.11%
2005-1 0.66% 1 0.53% 2 0.28% 3 0.13% 5 1.60%
2009-1 1.40% 1 -0.31% 2 0.32% 3 -1.73% 5 -0.33%
2013-1 0.07% 1 0.58% 2 0.67% 3 0.37% 5 1.70%
2017-1 0.12% 1 1.05% 2 0.07% 3 0.32% 5 1.56%
2021-1 -1.26% 1 -0.50% 2 0.44% 3 -2.23% 5 -3.55%
Avg 0.20% 0.27% 0.36% -0.63% 0.20%
OTC summary for PY1 1965 - 2021
Averages -0.31% -0.02% 0.17% 0.12% -0.05%
%Winners 40% 60% 80% 80% 60%
MDD 11/21/1973 4.73% -- 11/26/2021 3.52% --4 11/21/2001 3.07%
OTC summary for all years 1963 - 2024
Averages -0.06% -0.12% 0.36% 0.37% 0.54%
% Winners 52% 56% 77% 75% 68%
SPX PY1
Day4 Day3 Day2 Day1 Totals
1953-1 -0.33% 1 0.57% 2 0.08% 3 0.57% 5 0.90%
1957-1 0.76% 1 -2.65% 2 2.89% 3 1.14% 5 2.14%
1961-1 0.14% 1 0.08% 2 -0.11% 3 0.20% 5 0.31%
1965-1 -0.65% 1 0.15% 2 0.17% 3 0.10% 5 -0.23%
1969-1 -1.15% 1 -0.32% 2 0.36% 3 0.58% 5 -0.53%
1973-1 -3.05% 1 -2.04% 2 1.11% 3 -0.32% 5 -4.29%
1977-1 -0.08% 1 0.88% 2 0.42% 3 0.21% 5 1.42%
1981-1 -0.09% 1 1.57% 2 0.44% 3 0.84% 5 2.76%
Avg -1.00% 0.05% 0.50% 0.28% -0.17%
1985-1 -0.58% 1 0.16% 2 0.93% 3 -0.18% 5 0.33%
1989-1 -0.66% 1 0.07% 2 0.68% 3 0.60% 5 0.69%
1993-1 -0.75% 1 0.41% 2 0.29% 3 0.15% 5 0.10%
1997-1 -1.70% 1 0.44% 2 0.09% 3 0.40% 5 -0.78%
2001-1 1.09% 1 -0.73% 2 -0.49% 3 1.17% 5 1.04%
Avg -0.52% 0.07% 0.30% 0.43% 0.28%
2005-1 0.53% 1 0.51% 2 0.35% 3 0.21% 5 1.59%
2009-1 1.36% 1 -0.05% 2 0.45% 3 -1.72% 5 0.04%
2013-1 -0.13% 1 0.01% 2 0.25% 3 -0.08% 5 0.06%
2017-1 0.13% 1 0.65% 2 -0.08% 3 0.21% 5 0.91%
2021-1 -0.32% 1 0.17% 2 0.23% 3 -2.27% 5 -2.20%
Avg 0.31% 0.26% 0.24% -0.73% 0.08%
SPX summary for PY1 1953 - 2021
Averages -0.30% -0.01% 0.45% 0.10% 0.24%
%Winners 33% 72% 83% 72% 72%
MDD 11/20/1973 5.03% -- 11/26/1957 2.65% -- 11/26/2021 2.27%
SPX summary for all years 1952 - 2024
Averages -0.08% 0.11% 0.32% 0.29% 0.64%
% Winners 47% 62% 77% 71% 70%
Report for the last 4 days of November.
The number following the year represents its position in the Presidential Cycle. The number following the daily return represents the day of the week;
1 = Monday, 2 = Tuesday etc.
OTC PY1
Day4 Day3 Day2 Day1 Totals
1965-1 -0.02% 3 0.47% 5 0.47% 1 0.11% 2 1.03%
1969-1 -0.55% 1 -1.24% 2 0.05% 3 -0.11% 5 -1.86%
1973-1 -3.26% 2 0.86% 3 -0.34% 4 -1.17% 5 -3.91%
1977-1 0.57% 5 -0.26% 1 -0.83% 2 -0.05% 3 -0.56%
1981-1 0.52% 2 0.49% 3 0.50% 5 0.17% 1 1.69%
Avg -0.55% 0.06% -0.03% -0.21% -0.72%
1985-1 -0.33% 1 0.24% 2 0.81% 3 0.30% 5 1.01%
1989-1 -0.10% 1 0.11% 2 -0.19% 3 0.06% 4 -0.12%
1993-1 0.85% 3 0.22% 5 -0.44% 1 0.38% 2 1.01%
1997-1 -2.09% 1 0.13% 2 0.35% 3 0.38% 5 -1.23%
2001-1 -0.27% 2 -2.48% 3 2.40% 4 -0.14% 5 -0.49%
Avg -0.39% -0.363 0.59% 0.20% 0.04%
2005-1 0.13% 5 -1.04% 1 -0.30% 2 0.00% 3 -1.20%
2009-1 -0.31% 2 0.32% 3 -1.73% 5 0.29% 1 -1.44%
2013-1 0.07% 1 0.58% 2 0.67% 3 0.37% 5 1.70%
2017-1 -0.15% 1 0.49% 2 -1.27% 3 0.72% 4 -0.21%
2021-1 0.44% 3 -2.23% 5 1.88% 1 -1.55% 2 -1.46%
Avg 0.04% -0.38% -0.15% -0.03% -0.52%
OTC summary for PY1 1965 - 2021
Averages -0.30% -0.22% 0.14% -0.02% -0.40%
% Winners 40% 67% 53% 67% 33%
MDD 11/30/1973 3.90% -- 11/28/2001 2.74% -- 11/26/2021 2.23%
OTC summary for all years 1963 - 2024
Averages 0.25% 0.14% 0.34% 0.04% 0.77%
% Winners 59% 68% 66% 61% 63%
MDD 11/30/2000 10.55% -- 11/30/1987 3.97% -- 11/30/1973 3.90%
SPX PY1
Day4 Day3 Day2 Day1 Totals
1929-1 -0.37% 5 -1.16% 1 -2.91% 2 1.26% 3 -3.19%
1933-1 0.30% 6 -3.49% 1 0.10% 2 1.86% 3 -1.23%
1937-1 4.92% 5 4.78% 6 -1.97% 1 1.37% 2 9.10%
1941-1 -0.86% 3 -0.65% 4 -0.98% 5 -0.22% 6 -2.70%
1945-1 1.24% 2 -0.52% 3 -0.18% 4 0.94% 5 1.48%
1949-1 0.25% 6 -0.56% 1 -0.19% 2 0.25% 3 -0.25%
1953-1 0.57% 2 0.08% 3 0.57% 5 0.41% 1 1.63%
1957-1 0.76% 1 -2.65% 2 2.89% 3 1.14% 5 2.14%
1961-1 0.01% 1 -0.14% 2 -0.07% 3 -0.53% 4 -0.72%
Avg 0.57% -0.76% 0.61% 0.44% 0.86%
1965-1 0.17% 3 0.10% 5 -0.25% 1 -0.21% 2 -0.18%
1969-1 -1.15% 1 -0.32% 2 0.36% 3 0.58% 5 -0.53%
1973-1 -0.91% 2 2.04% 3 -0.35% 4 -1.39% 5 -0.61%
1977-1 0.21% 5 -0.67% 1 -1.55% 2 0.30% 3 -1.72%
1981-1 1.57% 2 0.44% 3 0.84% 5 1.01% 1 3.85%
Avg -0.02% 0.32% -0.19% 0.06% 0.16%
1985-1 -0.58% 1 0.16% 2 0.93% 3 -0.18% 5 0.33%
1989-1 0.48% 1 0.05% 2 -0.63% 3 0.70% 4 0.59%
1993-1 0.29% 3 0.15% 5 -0.25% 1 -0.02% 2 0.17%
1997-1 -1.70% 1 0.44% 2 0.09% 3 0.40% 5 -0.78%
2001-1 -0.68% 2 -1.83% 3 1.03% 4 -0.07% 5 -1.54%
Avg -0.44% -0.21% 0.24% 0.16% -0.25%
2005-1 0.21% 5 -0.85% 1 0.00% 2 -0.64% 3 -1.28%
2009-1 -0.05% 2 0.45% 3 -1.72% 5 0.38% 1 -0.95%
2013-1 -0.13% 1 0.01% 2 0.25% 3 -0.08% 5 0.06%
2017-1 -0.04% 1 0.98% 2 -0.04% 3 0.82% 4 1.73%
2021-1 0.23% 3 -2.27% 5 1.32% 1 -1.90% 2 -2.62%
Avg 0.04% -0.33% -0.04% -0.28% -0.61%
SPX summary for PY1 1929 - 2021
Averages 0.20% -0.23% -0.11% 0.26% 0.12%
% Winners 58% 50% 46% 58% 42%
MDD 11/26/1929 4.40% -- 11/27/1933 3.49% -- 11/30/2021 2.86%
SPX summary for all years 1928 - 2024
Averages 0.16% 0.02% 0.05% 0.20% 0.42%
% Winners 63% 52% 55% 55% 55%
MDD 11/28/1931 7.09% -- 11/30/1987 6.53% -- 11/29/1950 4.49%
Conclusion
Friday was a strong day for prices, however, new lows out numbered new highs by a wide margin on both exchanges.
Next week is both a holiday week and the end of the month so it should be modestly positive on light volume.
The strongest sectors last week were Banks and Health care (for the 2nd week in a row); the weakest were Precious Metals and Electronics (both for the 3rd week in a row).
I expect the major averages to be higher on Friday November 28 than they were on Friday November 21.
More By This Author:
Technical Market Report For November 15, 2025Technical Market Report For November 8, 2025
Technical Market Report For Nov. 1, 2025
Comments
Log in or sign up to join the conversation.