
Technical Market Report For May 24, 2025
The good news is:
- Seasonality for next week has been mostly positive.
The Negatives
The market made a big turn last week and it appears the recent rally has ended.
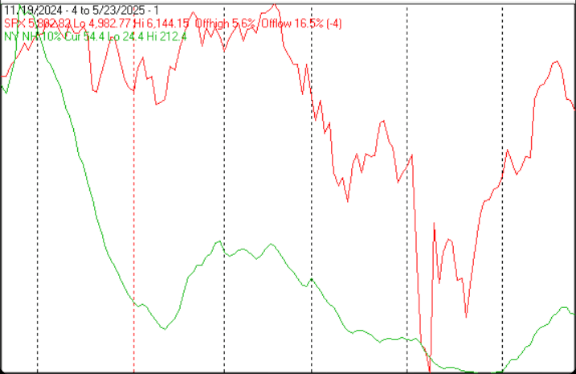
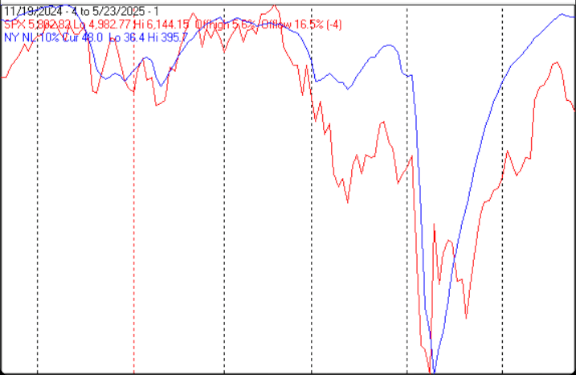
The first chart covers the last 6 months showing the S&P 500 (SPX) in red and a 10% trend (19 day EMA) of NYSE new highs (NY NH) in green. Dashed vertical lines have been drawn on the 1st trading day of each month.
NY NH turned downward from an already low level.
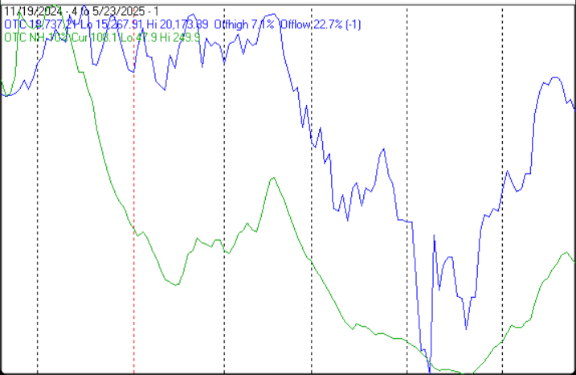
The next chart is similar to the 1st one except it shows the Nasdaq composite (OTC) in blue and OTC NH in green has been calculated with Nasdaq data.
OTC NH; Ditto.
The next chart covers the past 6 months showing the OTC in blue and a 40% trend (4 day EMA) of Nasdaq new highs divided by new highs + new lows (OTC HL Ratio), in red. Dashed vertical lines have been drawn on the 1st trading day of each month and dashed horizontal lines have been drawn at 10% levels for the indicator; the line is solid at the 50%, neutral level (equal numbers of new highs and new lows).
OTC HL Ratio went negative last week.

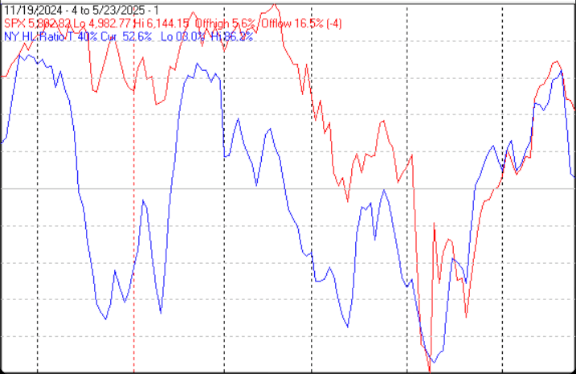
The next chart is similar to the one above except it shows the S&P 500 (SPX) in red and NY HL ratio, in blue, has been calculated with NYSE data.
NY HLR fell sharply to a barely positive 53%.
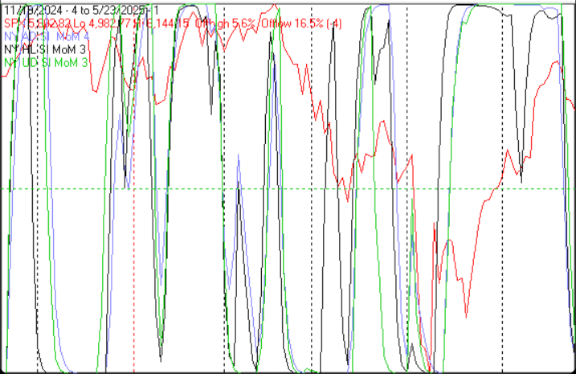
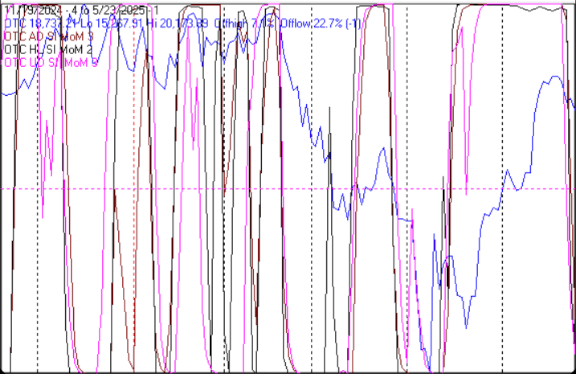
The next two charts show momentum of summation indices of advances – declines, new highs - new lows and upside – downside volume. I have shown these charts before. They went positive very near the April low and all of them went negative last week.
NY SI’s
OTC SI’s
The next chart covers the past 6 months showing the SPX in red and a 10% trend (19 day EMA) of NYSE new lows (NY NL) in blue. NY NL has been plotted on an inverted Y axis so decreasing numbers of new lows move the indicator upward (up is good).
NY NL turned modestly downward last week.
The Positives
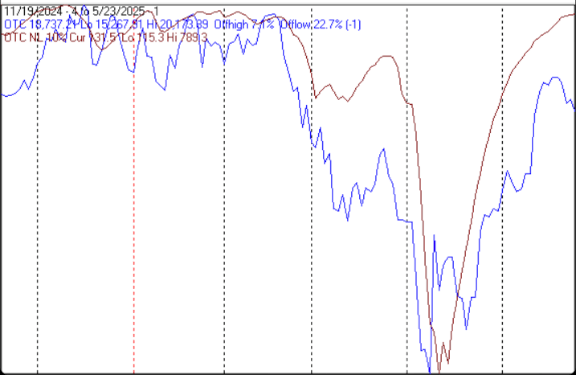
The next chart is similar to the one above except it shows the OTC in blue and OTC NL, in brown, has been calculated with Nasdaq data.
OTC NL has remained positive.
Seasonality
Next week includes the last 4 trading days of May during the 1st year of the Presidential Cycle. The tables below show the daily change, on a percentage basis, for that period.
OTC data covers the period from 1963 to 2024 while SPX data runs from 1928 to 2024. There are summaries for both the 1st year of the Presidential Cycle and all years combined.
Seasonally for next week has been mixed, but mostly positive.
Report for the last 4 days of May.
The number following the year represents its position in the Presidential Cycle.
The number following the daily return represents the day of the week; 1 = Monday, 2 = Tuesday etc.
OTC Presidential Year 1 (PY1)
Day4 Day3 Day2 Day1 Totals
1965-1 -0.73% 2 0.60% 3 -0.83% 4 -0.36% 5 -1.32%
1969-1 -0.13% 1 -0.09% 2 -0.75% 3 -0.27% 4 -1.24%
1973-1 0.86% 5 -0.30% 2 -1.58% 3 -0.53% 4 -1.56%
1977-1 -0.50% 3 -0.01% 4 -0.28% 5 -0.32% 2 -1.11%
1981-1 0.46% 2 0.88% 3 0.51% 4 0.07% 5 1.92%
Avg -0.01% 0.21% -0.59% -0.28% -0.66%
1985-1 -0.43% 2 -0.08% 3 -0.24% 4 0.30% 5 -0.46%
1989-1 0.32% 4 0.52% 5 -0.22% 2 0.44% 3 1.06%
1993-1 0.05% 2 1.30% 3 0.07% 4 -0.58% 5 0.85%
1997-1 1.40% 2 0.07% 3 -0.51% 4 -0.19% 5 0.77%
2001-1 -1.36% 5 -3.35% 2 -4.18% 3 1.25% 4 -7.65%
Avg 0.00% -0.31% -1.02% 0.24% -1.09%
2005-1 -0.56% 3 1.03% 4 0.22% 5 -0.36% 2 0.33%
2009-1 3.45% 2 -1.11% 3 1.20% 4 1.29% 5 4.83%
2013-1 0.86% 2 -0.61% 3 0.69% 4 -1.01% 5 -0.08%
2017-1 0.69% 4 0.08% 5 -0.11% 2 -0.08% 3 0.58%
2021-1 -0.03% 2 0.59% 3 -0.01% 4 0.09% 5 0.64%
Avg 0.88% 0.00% 0.39% -0.01% 1.26%
OTC summary for PY1 1965 - 2021
Averages 0.29% -0.03% -0.40% -0.02% -0.16%
% Winners 53% 53% 33% 40% 53%
MDD 5/30/2001 8.65% -- 5/31/1973 2.41% -- 5/28/1965 1.32%
OTC summary for all years 1963 - 2024
Averages 0.15% 0.12% 0.27% 0.18% 0.73%
% Winners 56% 61% 58% 61% 63%
MDD 5/30/2001 8.65% -- 5/27/1970 3.17% -- 5/25/1999 2.97%
SPX PY1
Day4 Day3 Day2 Day1 Totals
1929-1 -3.32% 1 1.61% 2 0.12% 3 0.85% 5 -0.73%
1933-1 2.86% 5 3.21% 6 1.45% 1 -1.43% 3 6.10%
1937-1 -1.28% 2 -0.12% 3 0.18% 4 0.00% 5 -1.21%
1941-1 0.64% 2 0.00% 3 -0.11% 4 -0.32% 6 0.22%
1945-1 0.54% 6 1.08% 1 0.53% 2 -0.66% 4 1.49%
1949-1 0.48% 3 -0.07% 4 -0.34% 5 -2.21% 2 -2.13%
1953-1 -0.48% 2 -0.92% 3 -0.73% 4 0.33% 5 -1.81%
1957-1 -0.91% 1 -0.19% 2 0.90% 3 0.68% 5 0.48%
1961-1 -0.63% 3 -0.38% 4 0.64% 5 0.20% 3 -0.18%
Avg -0.20% -0.10% 0.20% -0.33% -0.43%
1965-1 0.58% 2 -0.34% 3 -0.52% 4 0.66% 5 0.38%
1969-1 -0.22% 1 -0.76% 2 -0.30% 3 0.19% 4 -1.08%
1973-1 0.75% 5 -0.40% 2 -1.49% 3 -0.91% 4 -2.05%
1977-1 -0.92% 3 0.25% 4 -0.76% 5 -0.16% 2 -1.59%
1981-1 1.10% 2 0.75% 3 -0.24% 4 -0.64% 5 0.97%
Avg 0.26% -0.10% -0.66% -0.17% -0.68%
1985-1 -0.23% 2 -0.10% 3 0.04% 4 0.96% 5 0.67%
1989-1 0.01% 4 0.76% 5 -0.79% 2 0.46% 3 0.44%
1993-1 0.19% 2 1.02% 3 -0.23% 4 -0.49% 5 0.49%
1997-1 0.32% 2 -0.29% 3 -0.37% 4 0.50% 5 0.15%
2001-1 -1.18% 5 -0.78% 2 -1.57% 3 0.62% 4 -2.91%
Avg -0.18% 0.12% -0.58% 0.41% -0.23%
2005-1 -0.34% 3 0.64% 4 0.10% 5 -0.61% 2 -0.21%
2009-1 2.63% 2 -1.90% 3 1.54% 4 1.36% 5 3.63%
2013-1 0.63% 2 -0.70% 3 0.37% 4 -1.43% 5 -1.13%
2017-1 0.44% 4 0.03% 5 -0.12% 2 -0.05% 3 0.31%
2021-1 -0.21% 2 0.19% 3 0.12% 4 0.08% 5 0.17%
Avg 0.63% -0.35% 0.40% -0.13% 0.55%
SPX summary for PY1 1929 - 2021
Averages 0.06% 0.11% -0.07% -0.08% 0.02%
% Winners 54% 42% 46% 50% 54%
MDD 5/30/2001 3.49% -- 5/27/1929 3.32% -- 5/31/1973 2.77%
SPX summary for all years 1928 - 2024
Averages 0.11% -0.01% 0.24% 0.00% 0.33%
% Winners 58% 49% 61% 55% 62%
MDD 5/31/1932 12.52% -- 5/28/1962 8.45% -- 5/31/1935 4.49%
Conclusion
The market indices had a rough week and the most of the breadth indicators went negative.
The strongest sectors last week were Precious Metals (up from the bottom last week) and Utilities while the weakest were Transportation and Electronics.
I expect the major averages to be lower on Friday May 30 than they were on Friday May 23.
Last week's positive forecast was a miss.
More By This Author:
Technical Market Report For May 17, 2025Technical Market Report For May 10, 2025
Technical Market Report For May 3, 2025


