
Technical Market Report For March 12, 2022
The good news is:
- The secondaries outperformed the blue chips last week.
The Negatives
New lows continued to run at very high levels.
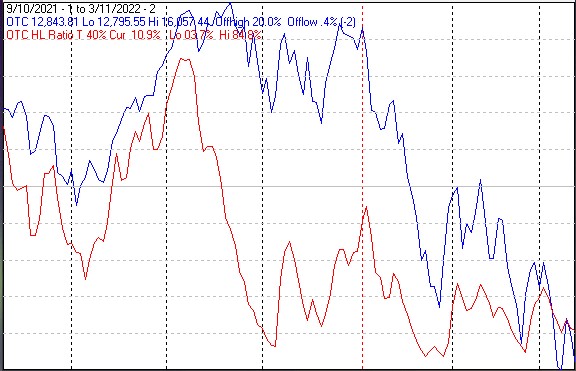
The first chart covers the past 6 months showing the Nasdaq composite (OTC) in blue and a 40% trend (4 day EMA) of Nasdaq new highs divided by new highs + new lows (OTC HL Ratio), in red. Dashed vertical lines have been drawn on the 1st trading day of each month and dashed horizontal lines have been drawn at 10% levels for the indicator; the line is solid at the 50%, neutral level.
OTC HL Ratio has been in negative territory for over 3 months.
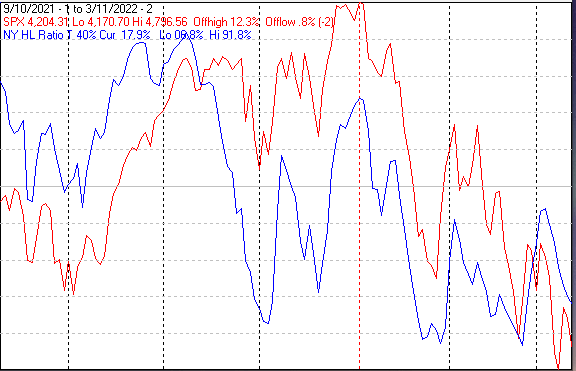
The next chart is similar to the first one except it shows the S&P 500 (SPX) in red and NY HL ratio, in blue, has been calculated with NYSE data.
NY HL Ratio reversed its upward its upward spike of the previous week and moved deeper into negative territory last week.
The next chart covers the past 6 months showing the SPX in red and a 10% trend (19 day EMA) of NYSE new highs (NY NH) in green.
NY NH turned downward after a little tease a week ago.

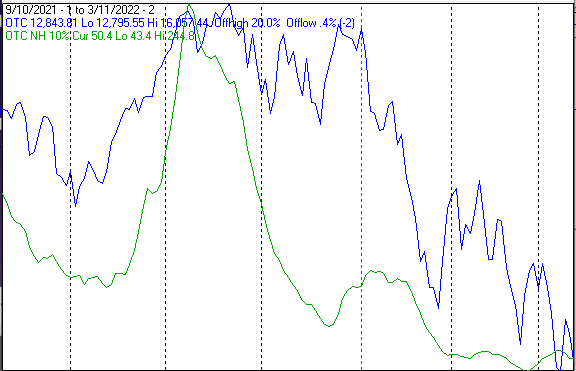
The next chart is similar to the one above except it shows the OTC in blue and OTC NH, in green, has been calculated with Nasdaq data.
Nothing happy going on here.
The next chart covers the past 6 months showing the SPX in red and a 10% trend (19 day EMA) of NYSE new lows (NY NL), in blue. NY NL has been plotted on an inverted Y axis so decreasing numbers of new lows move the indicator upward (up is good).
NY NL has been dancing around crash levels for over a month.

The next chart is similar to the previous one except it shows the OTC in blue and OTC NL, in brown, has been calculated with Nasdaq data.
OTC NL is a tease. The last confirmed low was over a month ago, but, although it's low, the levels remain crash worthy.

The Positives
Precious metals, Utilities and Energy have been doing ok.
Seasonality
Next week includes the 5 trading days prior to the 3rd Friday of March during the 2nd year of the Presidential Cycle. The tables below show the daily change, on a percentage basis, for that period.
OTC data covers the period from 1963 to 2020 while SPX data runs from 1953 to 2020. There are summaries for both the 2nd year of the Presidential Cycle and all years combined. Prior to 1953 the market traded 6 days a week so that data has been ignored.
Average returns for the coming week have been mixed and a little stronger during the 2nd year of the Presidential then other years.
Report for the week before the 3rd Friday of March.
The number following the year is the position in the Presidential Cycle.
Daily returns from Monday through 3rd Friday.
OTC Presidential Year 2 (PY2)
Year Mon Tue Wed Thur Fri Totals
1966-2 -0.19% -0.92% -0.63% 0.23% 0.28% -1.22%
1970-2 -2.13% -0.76% 1.04% 0.17% 0.06% -1.62%
1974-2 0.74% -0.07% 0.55% 0.19% 0.02% 1.42%
1978-2 0.11% 0.13% 0.14% 0.56% 0.54% 1.46%
1982-2 -0.18% 0.21% -0.05% 1.15% 0.96% 2.09%
1986-2 -0.47% 0.38% 0.05% 0.27% -0.03% 0.21%
1990-2 -0.05% -0.45% 0.36% 0.44% 0.94% 1.24%
1994-2 0.46% 0.09% 0.69% 0.61% 0.01% 1.85%
1998-2 0.93% -0.50% 0.51% 0.65% -0.60% 0.99%
Avg 0.14% -0.05% 0.31% 0.62% 0.25% 1.28%
2002-2 -0.01% -1.68% -1.85% -0.42% 0.76% -3.20%
2006-2 0.22% 1.27% 0.69% -0.53% 0.30% 1.96%
2010-2 -0.23% 0.67% 0.47% 0.09% -0.71% 0.29%
2014-2 0.81% 1.25% -0.59% 0.27% -0.98% 0.75%
2018-2 0.36% -1.01% -0.19% -0.20% 0.00% -1.04%
Avg 0.23% 0.10% -0.29% -0.16% -0.12% -0.25%
OTC summary for PY2 1966 - 2018
Avg 0.03% -0.10% 0.08% 0.25% 0.11% 0.37%
Win% 50% 50% 64% 79% 71% 71%
OTC summary for all years 1963 - 2021
Avg -0.27% 0.17% -0.03% 0.15% -0.13% -0.12%
Win% 54% 56% 64% 71% 53% 58%
SPX PY2
Year Mon Tue Wed Thur Fri Totals
1954-2 -0.45% -0.04% 0.23% 0.41% 0.30% 0.45%
1958-2 -0.69% -0.36% 0.48% 0.05% 0.74% 0.22%
1962-2 -0.03% 0.28% 0.44% 0.21% -0.17% 0.74%
1966-2 -1.13% -0.57% 0.58% 0.35% 0.41% -0.35%
1970-2 -1.08% 0.44% 0.29% -0.14% -0.41% -0.91%
1974-2 1.12% 0.27% 0.60% -0.09% -0.37% 1.53%
1978-2 0.08% 0.45% -0.26% 0.44% 0.77% 1.48%
Avg -0.21% 0.17% 0.33% 0.15% 0.05% 0.50%
1982-2 0.77% -0.16% -0.18% 1.12% 0.28% 1.83%
1986-2 -0.79% 0.47% -0.08% 0.40% -1.35% -1.35%
1990-2 0.22% -0.79% 0.26% 0.36% 1.14% 1.18%
1994-2 0.20% -0.08% 0.52% 0.32% 0.03% 0.99%
1998-2 1.00% 0.11% 0.46% 0.39% 0.87% 2.83%
Avg 0.28% -0.09% 0.20% 0.52% 0.19% 1.10%
2002-2 0.34% -0.23% -0.99% -0.09% 1.14% 0.17%
2006-2 0.20% 1.04% 0.43% 0.18% 0.15% 1.99%
2010-2 0.05% 0.78% 0.58% -0.03% -0.51% 0.86%
2014-2 0.96% 0.72% -0.61% 0.60% -0.29% 1.38%
2018-2 -0.13% -0.64% -0.57% -0.08% 0.17% -1.24%
Avg 0.28% 0.33% -0.23% 0.12% 0.13% 0.63%
SPX summary for PY2 1954 - 2018
Avg 0.04% 0.10% 0.13% 0.26% 0.17% 0.69%
Win% 59% 53% 65% 71% 65% 76%
SPX summary for all years 1953 - 2021
Avg -0.10% 0.26% 0.07% 0.18% -0.04% 0.37%
Win% 63% 55% 59% 57% 57% 62%
Conclusion
There is no relief in sight.
The strongest sectors last week were Precious metals (for the 5th week in a row) and Utilities (for the 3rd week in a row) while the weakest were Leisure and Internet.
I expect the major averages to be lower on Friday, March 18 than they were on Friday, March 11.
Last week's positive forecast was a miss.


