
The good news is:
- Seasonality for next week is very strong.
The Negatives
Total volume continues to fall.
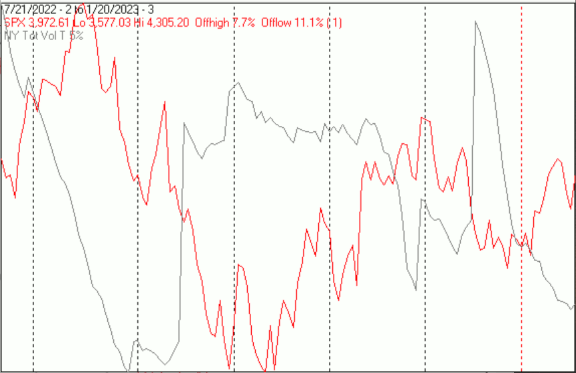
The first chart covers the past 6 months showing the S&P 500 (SPX) in red and a 5% trend (39 day EMA) of NYSE total volume in bluish grey. Dashed vertical lines have been drawn on the 1st trading day of each month.
Total exchange volume continued to fall.
The next chart covers the last 6 months showing the Nasdaq composite (OTC) in blue and a 10% trend (19 day EMA) of Nasdaq new highs (OTC NH) in green.
OTC NH continued to move downward while the index turned upward on Friday.

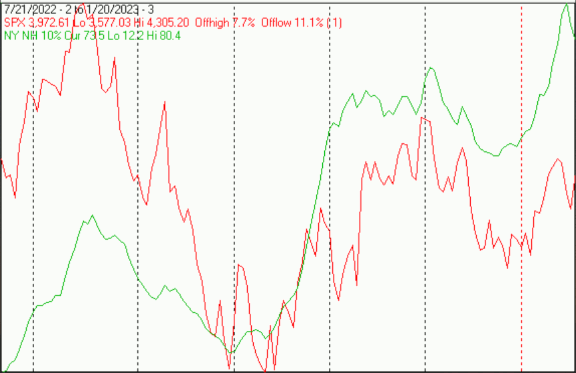
The next chart is similar to the one above except it shows the SPX in red and NY NH, in green, has been calculated with NYSE data.
NY NH also turned downward after hitting its highest level since April.
The Positives
The next chart covers the past 6 months showing the OTC in blue and a 40% trend (4 day EMA) of Nasdaq new highs divided by new highs + new lows (OTC HL Ratio), in red. Dashed horizontal lines have been drawn at 10% levels for the indicator; the line is solid at the 50%, neutral level (equal numbers of new highs and new lows).
OTC HL Ratio fell last week, but remains near its highest level in over a year.

The next chart is similar to the first one except it shows the SPX in red and NY HL ratio, in blue, has been calculated with NYSE data.
NY HL ratio also turned downward after reaching its highest level in over a year..

The next chart covers the past 6 months showing the OTC in blue and a 10% trend (19 day EMA) of Nasdaq new lows (OTC NL), in brown. OTC NL has been plotted on an inverted Y axis so decreasing numbers of New Lows move the indicator upward (up is good).
OTC NL continued its sharp upward move last week.

The next chart is similar to the above except it shows the SPX in red and NY NL in blue has been calculated with NYSE data.
NY NL also continued moving upward.

Seasonality
Next week includes the 5 trading days prior to the 4th Friday of January during the 3rd year of the Presidential Cycle. The tables below show the daily change, on a percentage basis for that period.
OTC data covers the period from 1963 to 2021 while SPX data runs from 1953 to 2021. There are summaries for both the 3rd year of the Presidential Cycle and all years combined. Prior to 1953 the market traded 6 days a week so that data has been ignored.
Average returns for the coming week have been positive by all measures.
Report for the week before the 4th Friday of January.

The number following the year is the position in the Presidential Cycle.

Daily returns from Monday through the 4th Friday.


OTC Presidential Year 3 (PY3)

 Year       Mon     Tue     Wed    Thur    Fri    Totals

 1963-3   0.00%   0.00%   0.00%   0.00%   0.00%   0.00%

 1967-3   0.62%  -0.34%  -0.11%  -0.10%   0.02%   0.08%

 1971-3   0.50%   0.09%  -0.29%  -0.47%   0.91%   0.75%

 1975-3   0.53%  -0.40%  -0.09%   0.58%   1.38%   1.99%

 1979-3   0.01%   0.64%  -0.10%   0.86%   0.49%   1.91%


 Avg      0.42%   0.00%  -0.15%   0.22%   0.70%   1.18%


 1983-3  -2.97%   1.04%   0.94%   1.66%   0.61%   1.28%

 1987-3   0.70%  -0.14%  -0.64%   0.93%  -0.25%   0.60%

 1991-3   0.72%  -0.18%   1.29%   1.93%   0.75%   4.52%

 1995-3  -0.33%   0.49%  -0.29%  -0.45%   0.18%  -0.41%

 1999-3   1.30%   2.71%  -1.10%   2.93%   1.15%   7.00%


 Avg     -0.12%   0.78%   0.04%   1.40%   0.49%   2.60%


 2003-3   0.00%  -0.87%  -0.35%   2.12%  -3.32%  -2.42%

 2007-3  -0.83%   0.01%   1.43%  -1.30%   0.05%  -0.63%

 2011-3   1.04%   0.06%   0.74%   0.58%  -2.48%  -0.06%

 2015-3   0.00%   0.44%   0.27%   1.78%   0.16%   2.65%

 2019-3   0.00%  -1.91%   0.08%   0.68%   1.29%   0.14%


 Avg      0.11%  -0.45%   0.44%   0.77%  -0.86%  -0.06%


OTC summary for PY3 (1963 - 2019)

 Avg      0.12%   0.12%   0.13%   0.84%   0.07%   1.24%

 Win%       73%     57%     43%     71%     79%     71%


OTC summary for all years 1963 - 2022

 Avg     -0.12%  -0.10%   0.17%   0.09%   0.06%   0.13%

 Win%       54%     49%     59%     48%     68%     59%


SPX PY3

 Year       Mon     Tue     Wed    Thur    Fri    Totals

 1955-3   0.23%  -0.03%   1.24%   0.11%   0.56%   2.10%

 1959-3  -0.23%   0.07%   0.57%  -0.12%   0.05%   0.34%


 1963-3   0.15%   0.25%   0.28%   0.20%   0.26%   1.13%

 1967-3   0.37%   0.14%  -0.76%  -0.05%   0.41%   0.11%

 1971-3   0.42%   0.33%  -0.73%   0.34%   0.70%   1.06%

 1975-3   0.17%  -0.53%   1.47%   0.46%   1.26%   2.83%

 1979-3   0.15%   0.70%  -0.44%   1.03%   0.66%   2.10%


 Avg      0.25%   0.18%  -0.04%   0.40%   0.66%   1.45%


 1983-3  -2.70%   1.27%  -0.15%   1.93%   0.17%   0.52%

 1987-3   1.15%  -0.11%  -0.45%   2.27%  -1.39%   1.47%

 1991-3  -0.35%  -0.83%   0.58%   1.38%   0.39%   1.17%

 1995-3   0.22%   0.01%   0.34%   0.19%   0.44%   1.20%

 1999-3   0.72%   1.48%  -0.73%   1.79%   1.12%   4.38%


 Avg     -0.19%   0.36%  -0.08%   1.51%   0.14%   1.75%


 2003-3   0.00%  -1.57%  -1.04%   1.02%  -2.92%  -4.51%

 2007-3  -0.53%   0.35%   0.85%  -1.13%  -0.12%  -0.57%

 2011-3   0.58%   0.03%   0.42%   0.22%  -1.79%  -0.53%

 2015-3   0.00%   0.15%   0.47%   1.53%  -0.55%   1.61%

 2019-3   0.00%  -1.42%   0.22%   0.14%   0.85%  -0.21%


 Avg      0.03%  -0.49%   0.18%   0.36%  -0.91%  -0.84%


SPX summary for PY3 1955 - 2019

 Avg      0.03%   0.02%   0.13%   0.66%   0.01%   0.83%

 Win%       71%     65%     59%     82%     71%     76%


SPX summary for all years 1953 - 2022

 Avg     -0.10%   0.00%   0.15%   0.14%   0.02%   0.23%

 Win%       53%     59%     57%     59%     54%     64%
Conclusion
The unresponsiveness of new highs to Friday’s strong rally is troubling.
The strongest sectors last week were Precious Metals (for the 3rd week) and Transportation while the weakest were Biotech (for the 3rd week) and Utilities.
I expect the major averages to be higher on Friday, January 27 than they were on Friday, January 20.
Last week the OTC was up while the other major averages were down, so I am calling last week's positive forecast a tie.
More By This Author:
Technical Market Report For January 14, 2023
Technical Market Report For January 7, 2023
Technical Market Report For December 31, 2022


Comments
Log in or sign up to join the conversation.