
Technical Analysis Of Autodesk Inc.

Photo by Maxim Hopman on Unsplash
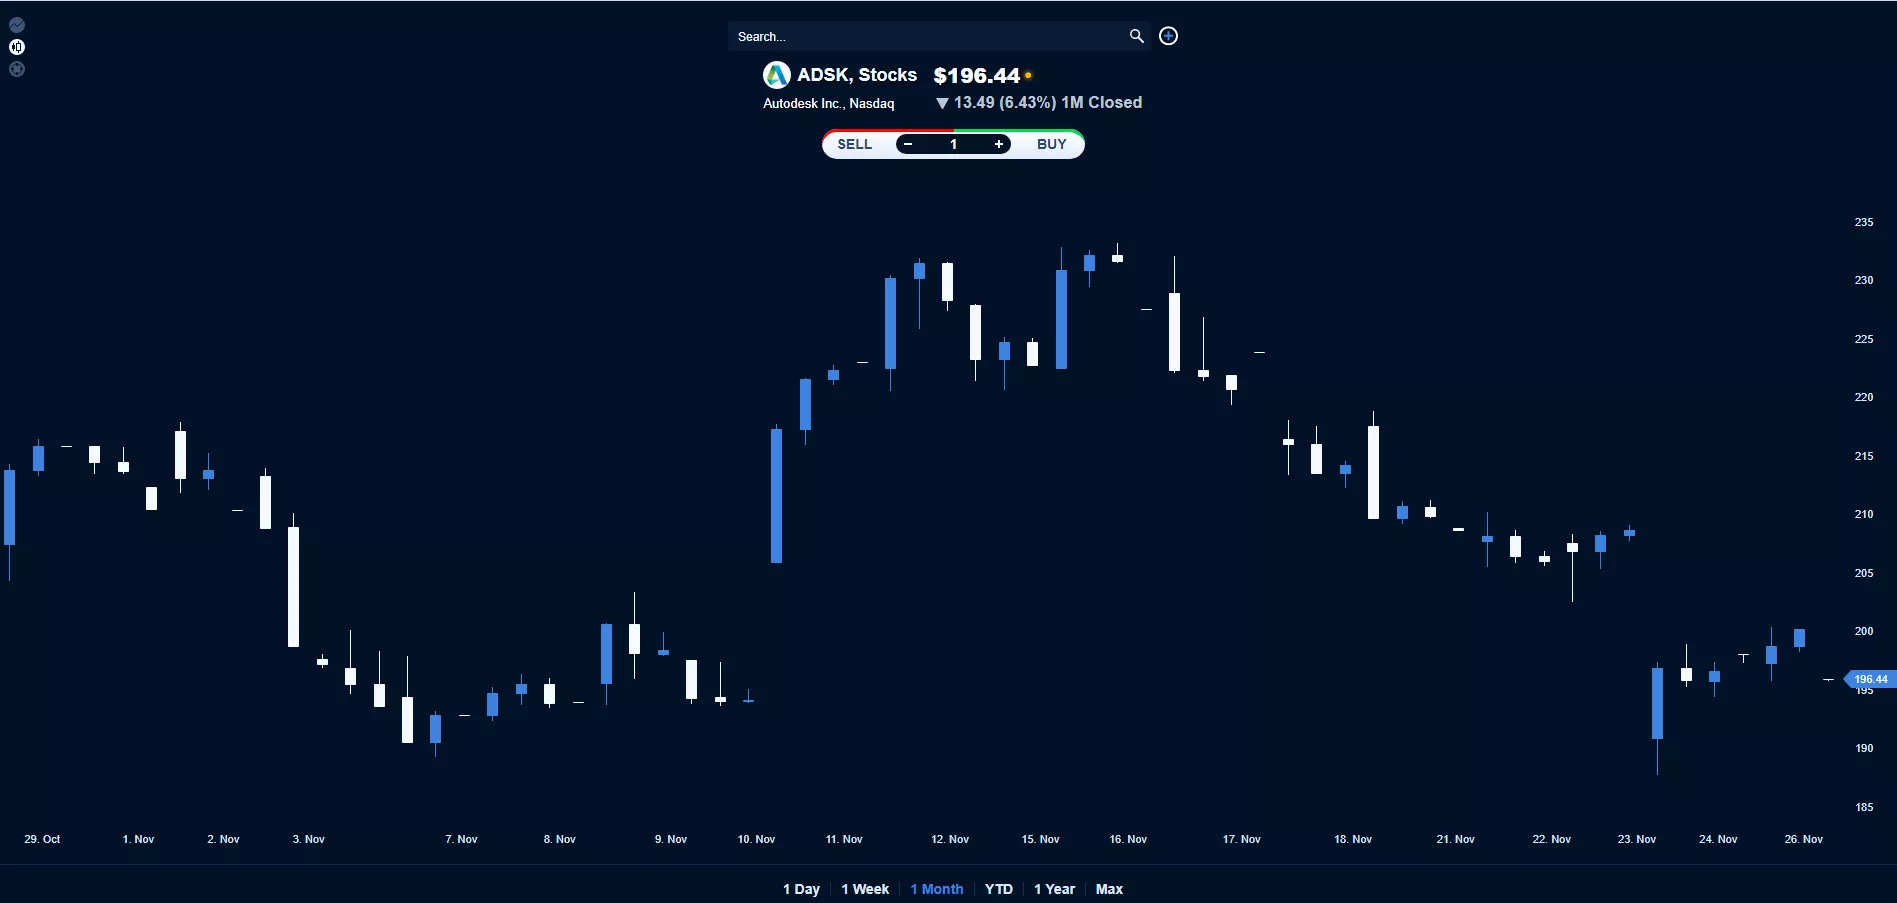
Today’s instrument is the Autodesk Inc. stock traded in the Nasdaq exchange under the ticker ADSK.
Looking at Autodesk’s chart, we can see that after the past week when it had fallen below the level of $190 due to the announced quarterly earnings, it recovered to above $200, and today during the pre-market session it fell below $200. Today we could expect it to test its support level at around $194.50 before heading towards its resistance level which is located at around $200.
(Click on image to enlarge)
More By This Author:
Daily Technical Analysis Of Euro/Dollar For Monday, Nov. 28
Daily Technical Analysis Of EURUSD - Friday, Nov. 25
Intraday Technical Analysis Of Pinduoduo Inc.
Disclaimer: Trading is risky. Information presented herein, is not to be constructed as a solicitation or an offer to buy or sell any Financial Instrument or to participate in any particular ...
more

