
Tech Sunset
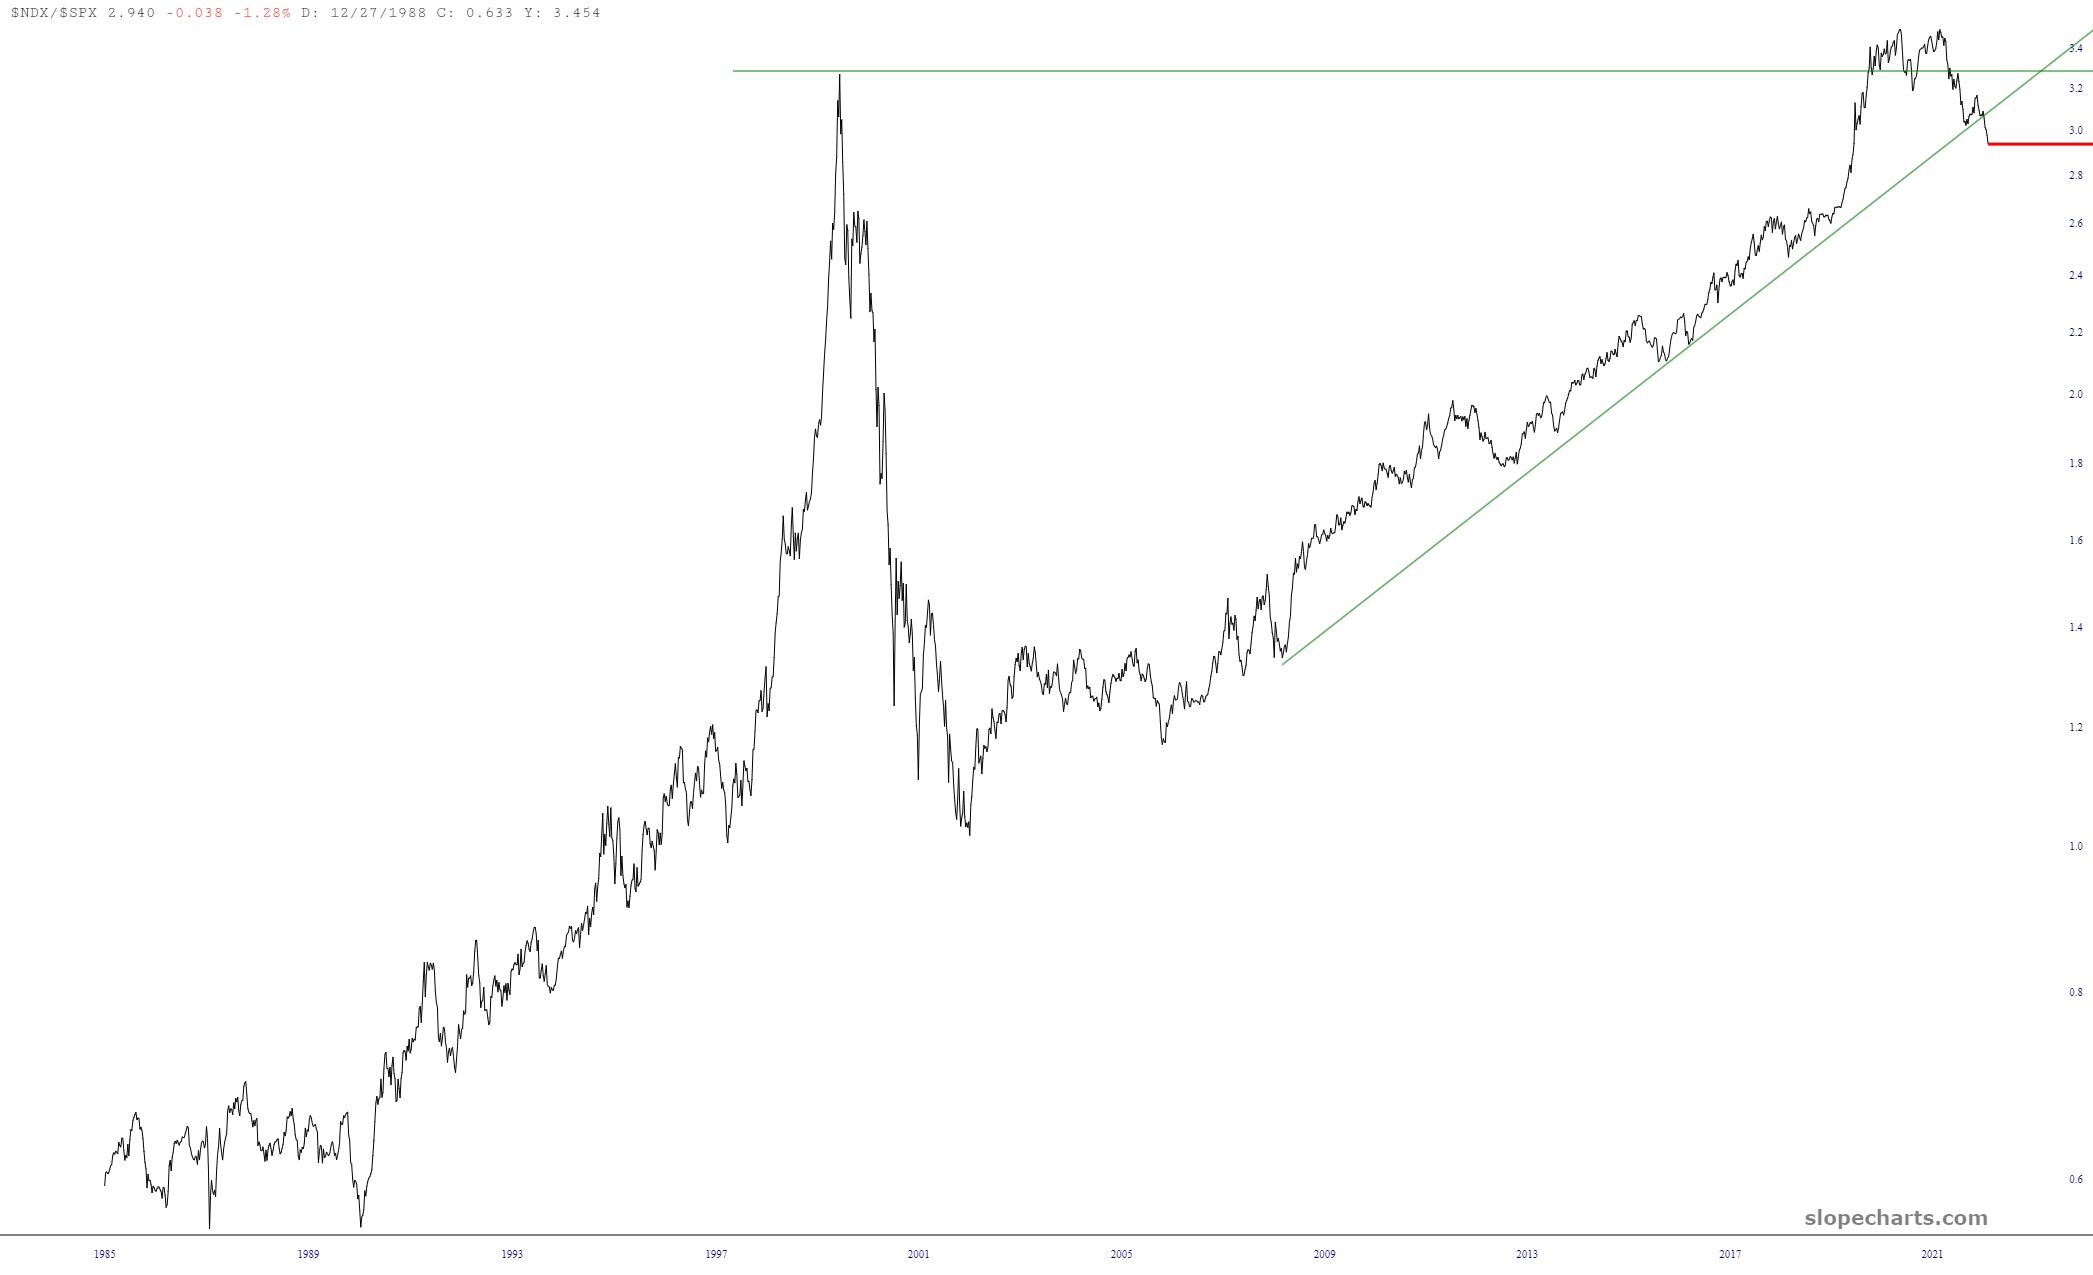
You wouldn’t know it from the quotes on your screen, but this has been a bad week for tech stocks. One succinct way to see what a sea change has taken place in the market is to look at the ratio chart of the Nasdaq 100 divided by the S&P 500. The long-term uptrend has clearly broken.
(Click on image to enlarge)
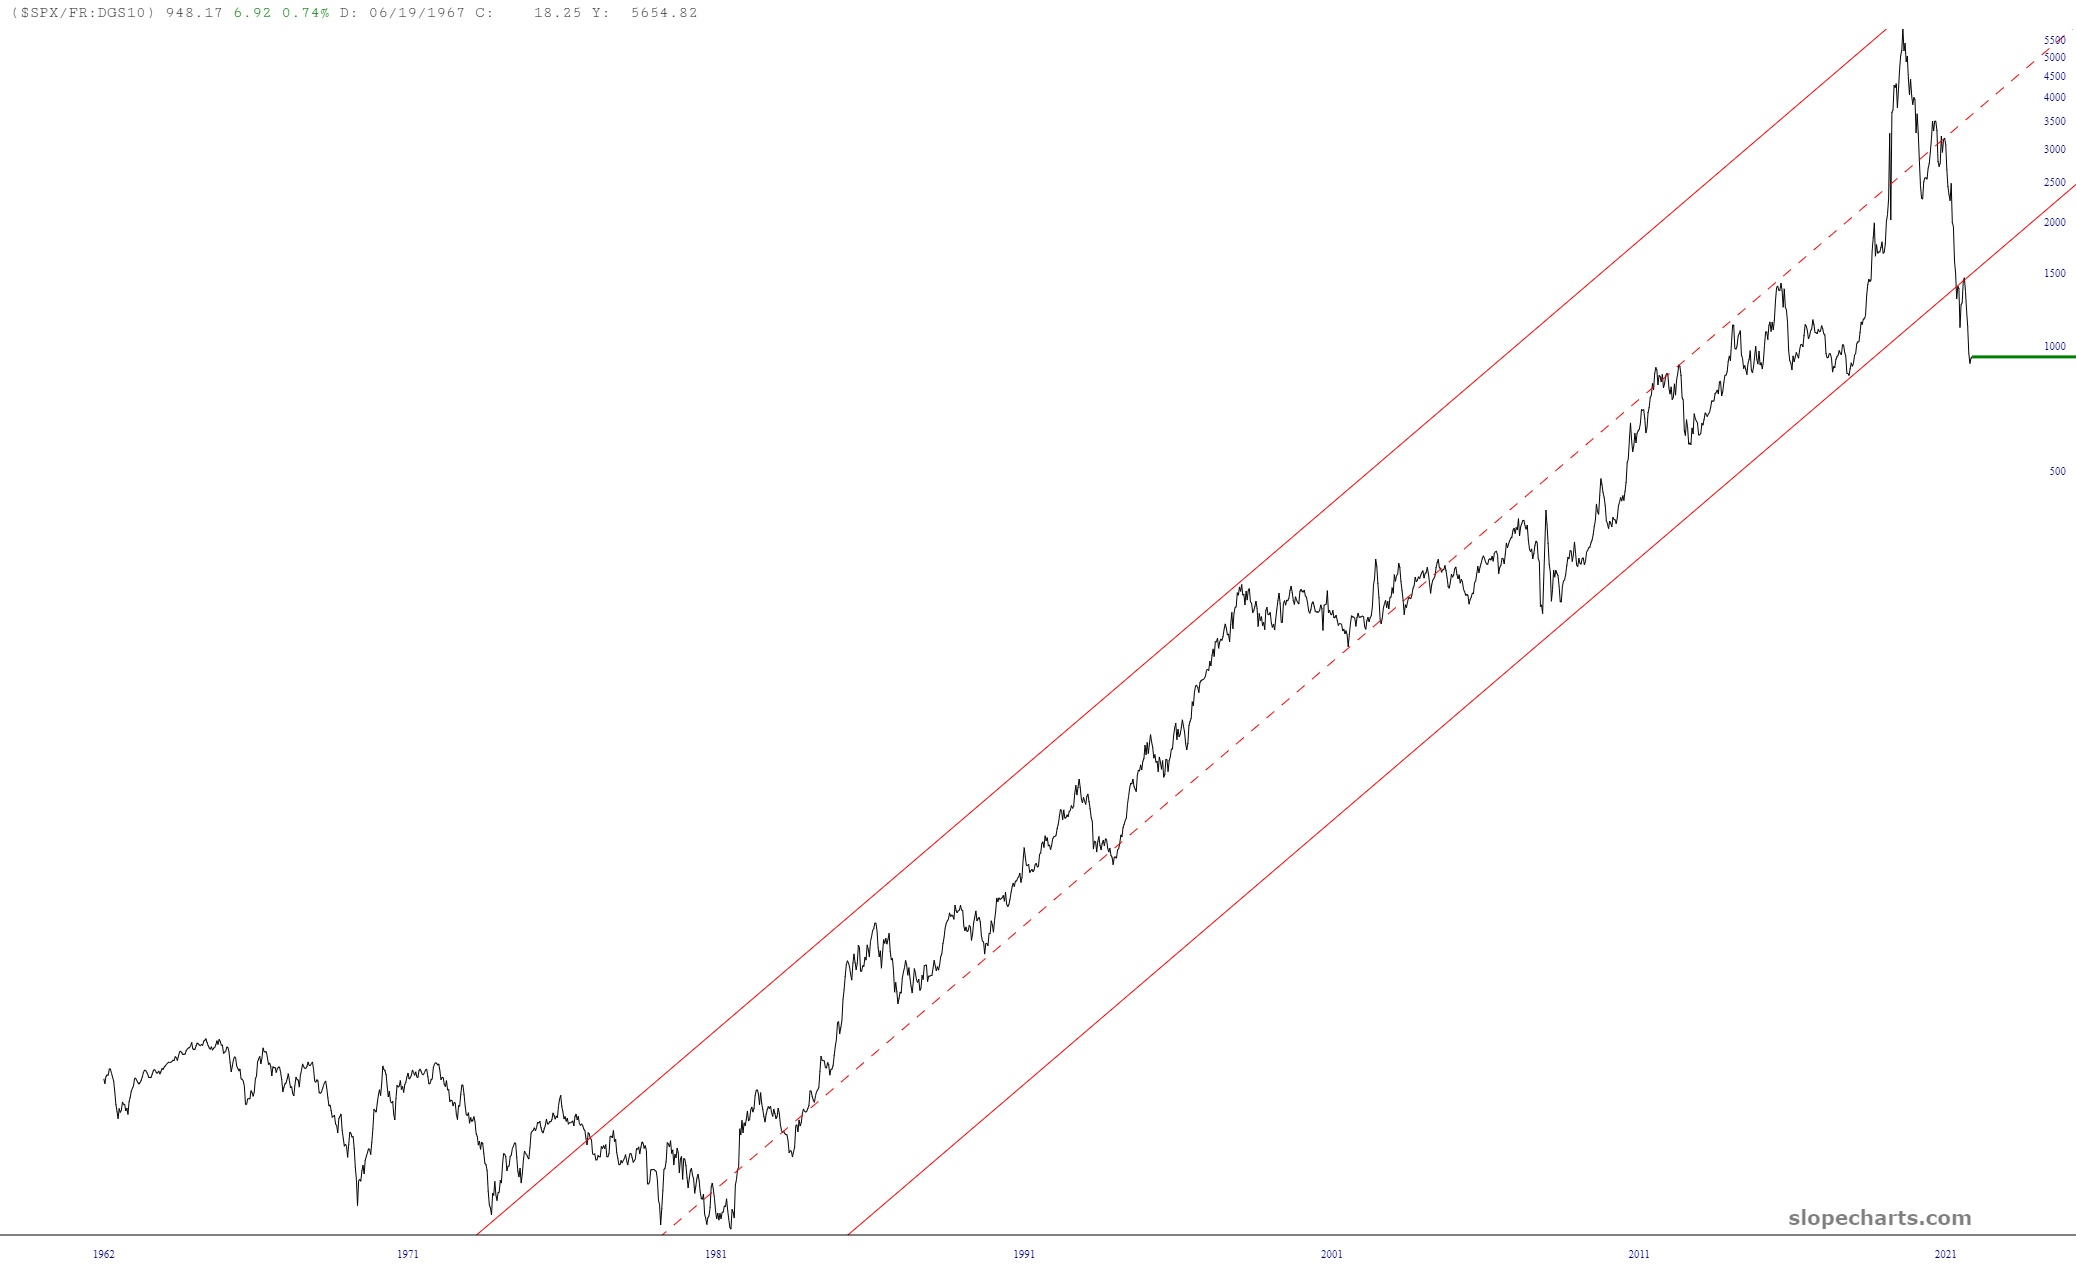
As long as we’re looking at ratio charts, here’s the MICE update, which shows what a pivotal year 2022 has been, in which interest rates have raged higher and – – the past two weeks notwithstanding – – stocks have substantially weakened.
(Click on image to enlarge)
More By This Author:
How did you like this article? Let us know so we can better customize your reading experience.

Comments
Leave a comment to automatically be entered into
our contest to win a free Echo Show.

