
Technology shares led overall markets higher from 2020 through 2021 as government hand-outs, low-interest rates, and spare time enabled both a retail spending boom and a gambling frenzy in financial markets.
From the March 20, 2020, COVID crash lows of 6,879, the tech-heavy Nasdaq composite index broke through 10,000 by July 2020 (not 3 months later) and 16,000 by November 2021. The benchmark then tumbled 33% to 10,646 by June 16, 2022. After rebounding into mid-August, the Nasdaq relapsed and, this morning at 10,569, is a new 52-week-low and back to where it was in July 2020. We are now less than 9% above the pre-COVID cycle high of 9,731 on February 9, 2020, but still 53% above the March 15, 2020 crash low. We are early days yet, March 15, 2020’s low remains our base case retest this cycle.
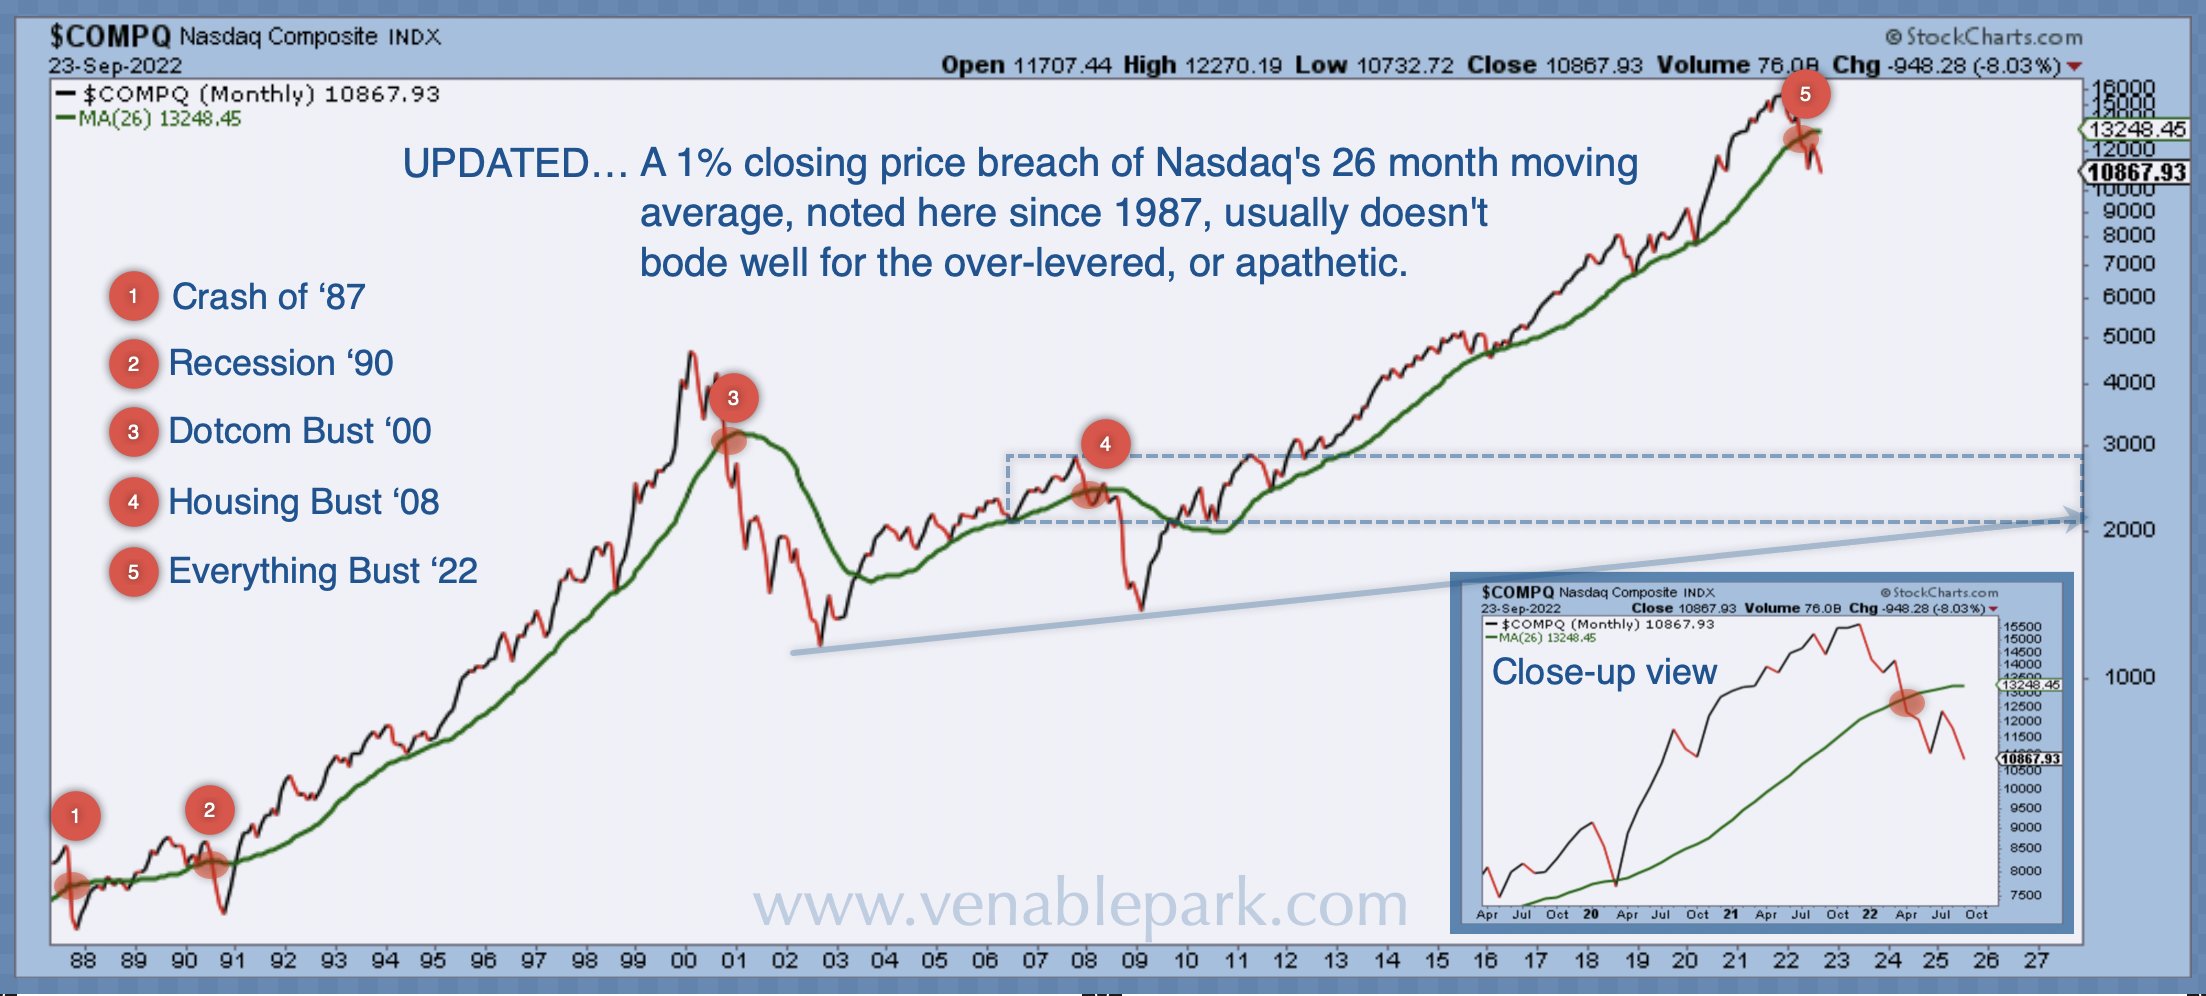
As shown below by my partner Cory Venable, the Nasdaq composite’s September 22, 2022 close at 10,876, was more than 1% below its 26-moving average for only the 5th time since 1987. The previous four incidents (see red circles) marked the onset of the last three recessions and major equity bear markets. The massive valuation overshoot in the recent everything bubble–and hence the downside now–is hard to appreciate until quantified and compared historically.
(Click on image to enlarge)
While tech has led the overall stock market, semiconductors–a critical component of the most widely used technology–have historically led the technology sector. Last week the semiconductor index (SMH) closed below the previous June low, now -40% since November 2021 and the lowest since July 12, 2020, but still 44% above its March 15, 2020 crash.
Thanks to its heavy weight in financials, fossil fuels, and materials, Canada’s TSX is still just over 15% under its March 2022 top and following at a lag, just as it did in 2008 (peaked in June 2008, when the Nasdaq peaked in July 2007) and in 2000 (TSX peaked in September 2000 when the Nasdaq peaked in January 2000). There’s no precedent to hope that the TSX’s relative outperformance will hold. As shown below, a breach of the July low of 18,329 and then the pre-COVID high of 17,944 are the next downside tests, but the March 2020 low remains a surreal 39% below Friday’s close.
(Click on image to enlarge)

The damage to Canadian balance sheets and the economy from plunging equity in homes and stock markets is about to get ugly. Unfortunately, financial mania has earned it.
More By This Author:
Remember, USD Love Is Cyclical Not Permanent
Housing Bubble Deflating
Private Equity Losses Not Yet Booked

Comments
Log in or sign up to join the conversation.