
Strong Rally Ahead In S&P 500 Upon Completion Of This Price Volume Pattern

Image Source: Pixabay
When S&P 500 completes this bullish price volume pattern, it is expected to test higher price targets and attract traders and investors who are on the sidelines. This is also one of the tell-tale signs when adopting the Wyckoff method to look for the market bottom as explained in the video. Price targets based on the Point and Figure chart are covered in the video.
Watch the video below and pay attention to the key levels and the price and volume characteristics for bull and bear cases.
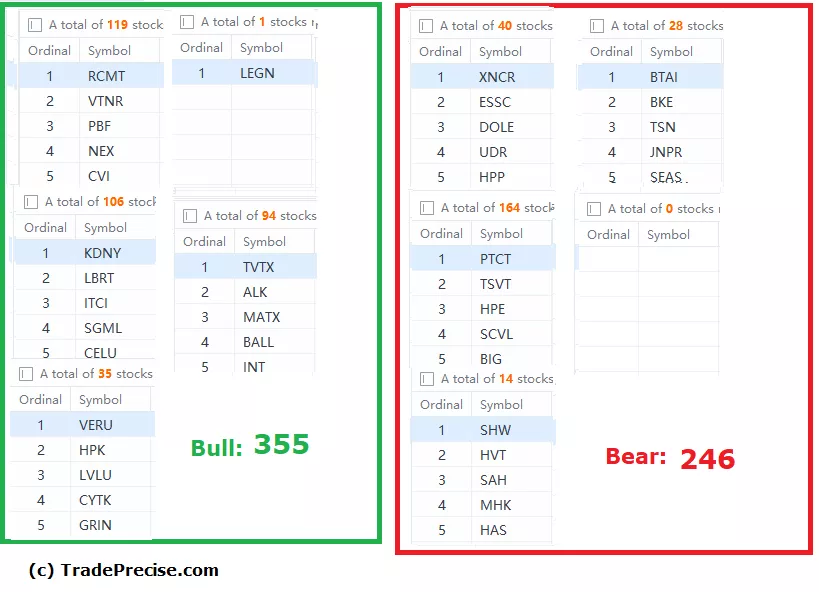
The bullish setup vs. bearish setup is 355 vs 246 from the screenshot of my stock screener below. The bearish trade setup has increased from last week yet there is much high-quality bullish setup while the market is consolidating.
The short-term uptrend is still intact until proven otherwise by a meaning reversal commits below the key level as mentioned in the video. This upswing is still a tradeable bear rally.
Video Length: 00:20:47
Disclaimer: The information in this presentation is solely for educational purpose and should not be taken as investment advice.


