Stocks Try To Stabilize After Recent Wobble
Image Source: Pexels
Financial markets have been notably calmer today. Major indices have recovered, with all showing positive movement, particularly driven by the Japanese Nikkei following encouraging comments from the Deputy Governor of the Bank of Japan yesterday. This positive sentiment has extended across global equity markets, Bitcoin, and metal prices. Additionally, stronger-than-expected US jobless claims data has alleviated fears of an economic slowdown in the US. This follows a robust ISM services PMI report on Monday, which has helped counterbalance weaker economic indicators from last week.
Still, sentiment is cautiously bearish, and more signs of a market bottom are needed to reignite bullish enthusiasm, even though there's been a hint of stability in the past couple of days. For example, the Nasdaq 100 has tested its technically-important 200-day moving average over the past couple of days and so far it has held above it. But now it needs to form a clear bullish signal to re-ignite the bullish momentum, while a close below it could lead to further follow-up technical selling. It may also be a good idea to keep a track of market movers today to provide hints about the general market direction or which sector is likely to under- or out-perform.
Bank of Japan’s Reassurance Eases Market Pressure
The focus has been on Japan and its central bank's actions. Global indices bounced back on Wednesday following a significant recovery in Japanese stocks after the Bank of Japan (BoJ) reassured markets. A top BoJ official pushed back against last week’s unexpectedly hawkish stance, and the lack of major bearish news alongside a quiet economic calendar slightly boosted risk appetite. However, investors remained hesitant to buy the dip, after carefully evaluating the potential impact of the carry trade unwind and the BoJ’s reassurances. Well, they kind of did buy the dip but were happy to take profit as the major indices hit broken support levels, which later turned into resistance and caused the markets to head lower into the close on Wednesday. Will we see a similar pattern today? Time will tell. But the recent reaction to the BoJ’s policy tightening and weakening US data has overall kept sentiment cautious, with traders waiting for clearer bullish signals, especially with US CPI data due next week.
In case you missed it, it BoJ Deputy Governor Shinichi Uchida’s comments that provided the relief on Wednesday, suggesting the central bank wouldn't raise rates during market instability and that Japan's monetary policy would adapt if market risk views changed. This reassurance came after a period of wild market swings, with benchmark indices plunging on Monday following a weak close last week. Expectations of more aggressive Federal Reserve rate cuts due to weak US economic data failed to provide support as the rapid unwinding of popular yen-funded carry trades had a more significant impact including in US tech stocks and therefore the Nasdaq 100.
Nasdaq 100 Technical Analysis and Trade Ideas
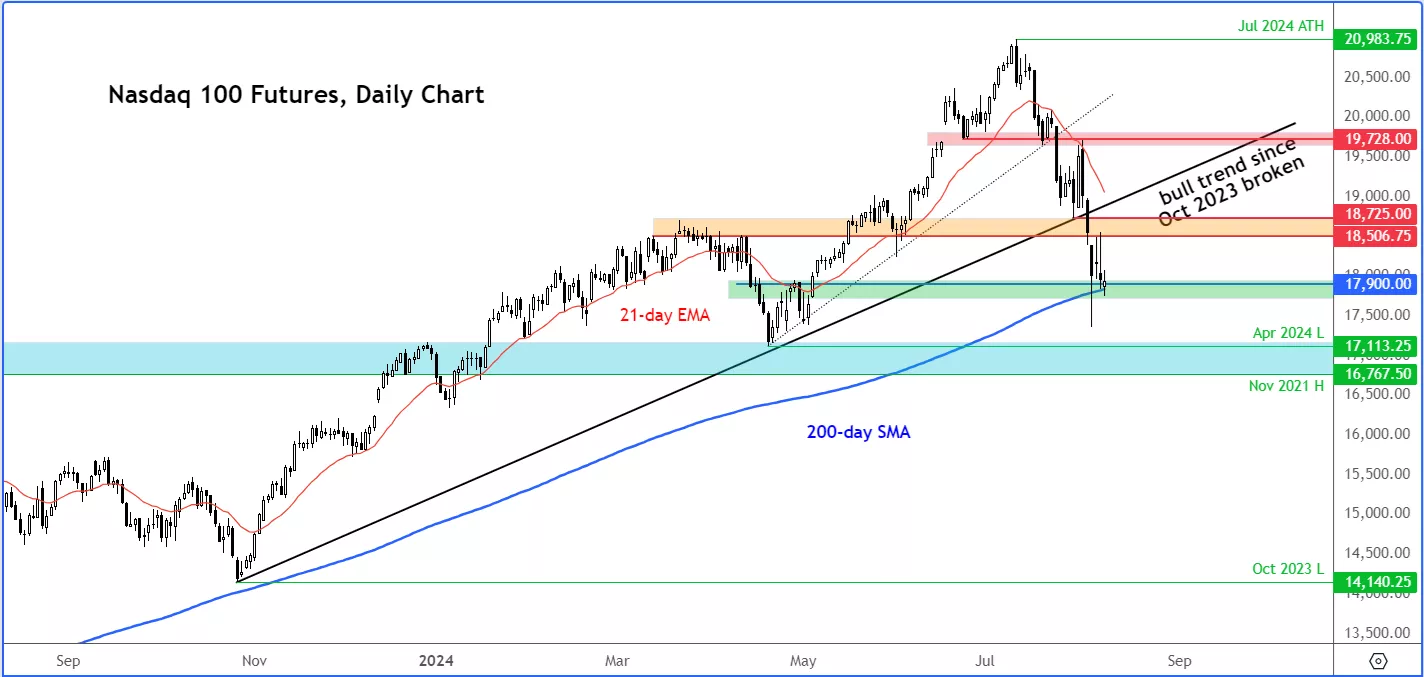
The Nasdaq has now fallen for 5 consecutive weeks. Unsurprisingly, this has pushed momentum indicators like the Relative Strength Index (RSI) to near oversold levels. This means that at the very least we should expect to see oversold bounces here and there – like we did for example on Wednesday. But with lots of support levels broken, the previous bullish trend on the Nasdaq 100 has been disrupted. Thus, the bulls are now in need of a clear bull signal to ignite a fresh rally.
Until a clear bullish reversal pattern is formed, any short-term recoveries you might see could turn out to be a bull trap. For that reason, it is essential to be more nimble and book profit near broken support levels as they could now turn into resistance.
At the time of writing, the Nasdaq futures chart was testing a critical technical zone between 17,750 to 17,900. This area marks the breakout zone from early May, and where the 200-day moving average comes into play.
In terms of resistance, the area between 18500 to 18725 is where the index has found resistance this week. This area had acted as support previously. So, as a minimum, we need to see the index move back above that area to create a bullish signal. Otherwise, we may chop around for the next few days ahead of the US CPI report, which comes out on Wednesday of next week.
(Click on image to enlarge)

However, there is certainly potential for further weakness should the Nasdaq break the 200-day moving average more decisively this time. If it does, we could well see a retest of this blue area, which is a more significant support zone.
More By This Author:
US Dollar Could Weaken More Broadly – Here’s Why
EUR/USD: Focus Turns To FOMC After Stronger Eurozone CPI
Gold Maintains Bullish Trend Ahead Of Busy Week


