

Image Source: Unsplash
Despite the noticeable drop in Nvidia-driven tech stocks this week, the major US indices remain not too far from their all-time highs hit in July. September is not usually a good month for the markets anyway, but so far there are no concrete signals that a major correction is upon us. That could change, however, if we start to see the breakdown of some key support levels that are now coming into play with investors keeping a close eye on a deteriorating US economy. Helping to keep the markets relatively supported are growing expectations that the Fed would embark on a policy easing cycle starting this month, which could mean around 100 basis points of cuts by year-end. But is this enough of a reason to keep the markets supported as we head deeper into September?
Bulls running out of excuses to buy
Remember the last two weeks of September has historically been the worst period for the S&P 500.
Indeed, the bears would argue that at current levels, there are no compelling reasons for continued buying, with companies about to head into their earnings buyback blackout periods.
As well as seasonality factors coming into play, the looming US elections present an additional layer of uncertainty. The potential for another trade war between the US and China cannot be ignored.
What’s more, recent concerns over China have hit the local markets there and this has weighed on global oil and base metals prices. As a result, we have seen some oil and mining companies struggle.
Yet financials have kept on rising, helping to offset weakness in other sectors.
In the US, weakness in labour market data has hit the dollar recently. So far, the major indices have shrugged off recession fears, but a weakening economy should mean lower profits for companies, and therefore lower share prices. This narrative could become more and more in focus if we see continued weakness in the labour market, putting Friday’s jobs report into a sharp focus on the US economic calendar. With the manufacturing sector struggling, it is all down to the services sector now. Today’s release of the ISM survey will shed some light into the health of the largest sector of the economy. Any sharp weaknesses here could spell trouble for stocks.
While weakness in the economy would help speed up the disinflationary process and lead to a sharper easing cycle, interest rates are still way too high for the bulls to cheer soft data like they did in the past. After yesterday’s weak JOLTS job openings data, the market’s pricing of the Fed's terminal rate hit a new - the market is now considering a terminal rate below 3% in two years’ time.
S&P technical analysis and trade ideas
Still, given the strong bullish trend this year, the bears must wait for a confirmed reversal signal before trying to take advantage of a potential correction. As things stand, the bullish trend does not appear to be over just yet.
Indeed, last month saw the S&P 500 create a hammer candle on the monthly time frame (not shown), after the markets rallied quite strongly in the second week of August eventually saw the S&P more than make up the entire sharp losses it had suffered in the first week of that month. The S&P then fell just short of breaking its record from July.
While the bullish momentum may have faded in recent weeks, the S&P could easily get to a new high with just a 2.7% rally from around the current levels. Stating these facts will help traders not lose sight of the bigger picture.
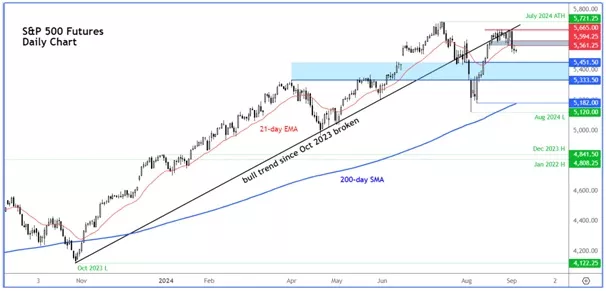
On the S&P 500 futures chart, the shaded grey area between 5561 to 5594 was a prior support area that gave way during Tuesday’s sharp drop. A move back above this zone would put the Bulls back in the driving seat. If so, we could then see follow-up technical buying towards the next potential area of resistance around 5665/5670, with the subsequent bullish objective being the July high of 5721.
In terms of the next potential short-term support level to watch, well there aren’t any obvious ones in close proximity. The rather large range shaded in blue on the chart between 5333 to 5451 needs to be monitored closely should we see a continuation of the correction from here. This upper end of this area was support in early August before it gave way and was subsequently reclaimed. So, if the trend is still bullish then one should expect this level to hold. If it doesn’t then we could see the onset of a deeper correction, with the next major support seen around the 200-day average at 5180ish.
More By This Author:
USD/CAD Faces Testing Week: ISM PMIs, BoC Rate Decision And Jobs Reports
What Now For Gold After Hitting $2500?
FX Week Ahead: Market Eyes Jackson Hole And PMI Data For Direction


Comments
Log in or sign up to join the conversation.