
Stocks In Nosebleed Territory – Speculative Frenzy
Having been in this business for over 40 years, I learned early-on that markets can go a lot higher (or lower) than professional forecasters expect. And some trends can last much longer than anyone anticipated, especially if the government and/or the Fed is underwriting them – as is the case with both today.
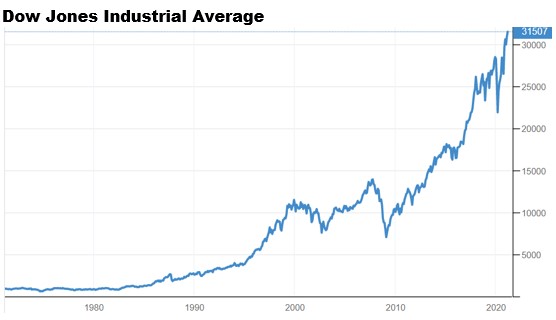
With that in mind, does anyone but me have the feeling this runaway bull market in stocks may be in its final thrust? After all, this is the longest and strongest bull market in history, and we’re seeing new record high after new record high. Could this market be approaching what professional traders call “terminal exhaustion” at long last? I’m seriously wondering.
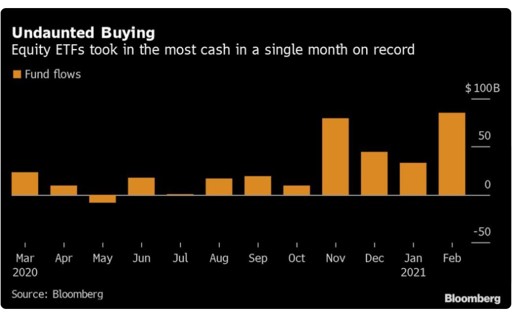
There are numerous indicators professionals watch to gauge whether markets are approaching a major top or bottom. One of those indicators is how much new money is pouring into the market (or leaving it). On that note, investors added more money to stocks in February than in any month on record.
As one example, investors added a record $86 billion to Exchange Traded Funds (ETFs) in February alone. Analysts attribute this surge in new money to the fact that Treasury yields have spiked this year, and investors are bailing on the bond market, opting for stocks instead. Whatever the reason, stocks are clearly “overbought” at this point, as you see in the chart above. Yet the overbought conditions and the flood of new money are just two concerns.
Another concern is the fact that stock margin debt has skyrocketed to new highs in recent months. Margin debt is money investors borrow from their brokers via a “margin account.” Margin debt can be money borrowed to buy securities or sell stocks short. The typical margin limit at most brokers is 25% of the account, but it can sometimes be higher.
As you can see in the chart below, margin debt has exploded in the last year, despite the COVID-19 recession in 2020. This is unusual. Normally, margin debt spikes before recessions occur, as you can see in 2000 and late 2007. This time is different.
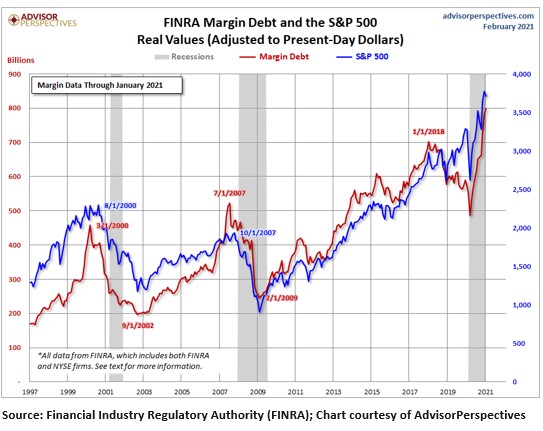
A spike in margin debt is an indication that stock speculation is excessive. Investors are so convinced stocks will continue higher, they are willing to borrow from their brokers to buy even more securities – thus increasing their risks significantly. We call this a “speculative bubble.”
These investors are chasing bigger gains and exposing themselves to potentially devastating losses through riskier plays, including concentrated positions, trading options and leveraged ETFs, which are becoming increasingly popular. The latest milestone is not a good sign for the stock market since margin debt records often precede market significant volatility.
Specifically, investors can get into trouble if their collateral falls below a certain threshold and triggers “margin calls,” which spiked in March of last year when stocks plunged due to coronavirus fears. Once there is a margin call, investors must decide whether to put up more money or sell the securities underlying the loans. Thus, margin calls can intensify market selloffs – another reason why margin debt spikes are typically not a good sign.
Unfortunately, there’s more. Some investors use their margin balances to trade options. In 2020, a record number of options contracts traded with an average 29 million options trading hands each day – a 48% increase from 2019, according to Options Clearing Corp. Traders can buy options to hedge their portfolios from stock declines, or more often to make bets that major indexes or individual companies will gain or lose value. Even more leverage!
Finally, here’s another perspective on overall market leverage at this point. This is a chart you aren’t going to see unless you are a subscriber to Investor’s Business Daily (IBD). This chart shows the percent of margin debt in use at any given time, which is currently just over 42%.
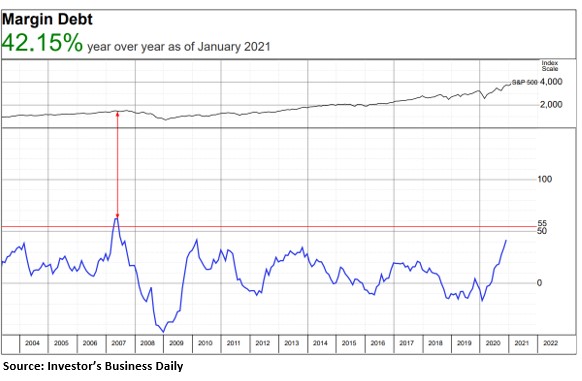
What’s important to know about this chart is this from IBD: Readings above 50% have signaled several bear markets or major downward corrections going back to the 1970s. A reading above 55%, IBD says, is an indicator that “…optimism runs rampant on Wall Street…”
While the indicator is still well below 50-55%, it could get there in a hurry if the current record advance continues.
Why am I telling you this? I am concerned because each of these indicators is troublesome or worse. As I said at the beginning, bull markets can run longer and higher than we might think. There’s certainly the possibility this bull market could run for several more months.
Or it may not! Worse, given the current record level of leverage and rampant speculation, this is a bubble ripe to be popped, in my opinion.


The big challenge to geting rich in a bull market is knowing when the cloud of buyers waiting to be fleeced will dry up and vanish, and selling ones shares to them just before that happens. Predicting the inadequarely predictable with enough accuracy probably requires a great deal of luck,and sometimes that luck is misunderstood and presumed to finally be the gift of great insight.
So the larger challenge is to understand when one has been very lucky, and to not presume that one has gained the ultimate insight instead.