
The GDXJ declined a bit, and it did so after reversing at its triangle-vertex-based turning point. As a reminder, when support and resistance lines cross, it indicates a good possibility of seeing a reversal. This technique doesn’t point to specific prices, but it points to specific times.
Since the GDXJ turned south at the reversal, the odds are that this was indeed the top or an early part thereof.
Besides, the previous breakout above the previous declining resistance line that we saw in early August was followed by significant short-term declines. This means that the current breakout should not be trusted.
Will stocks fully recover from their recent declines, or are there any bearish signs?
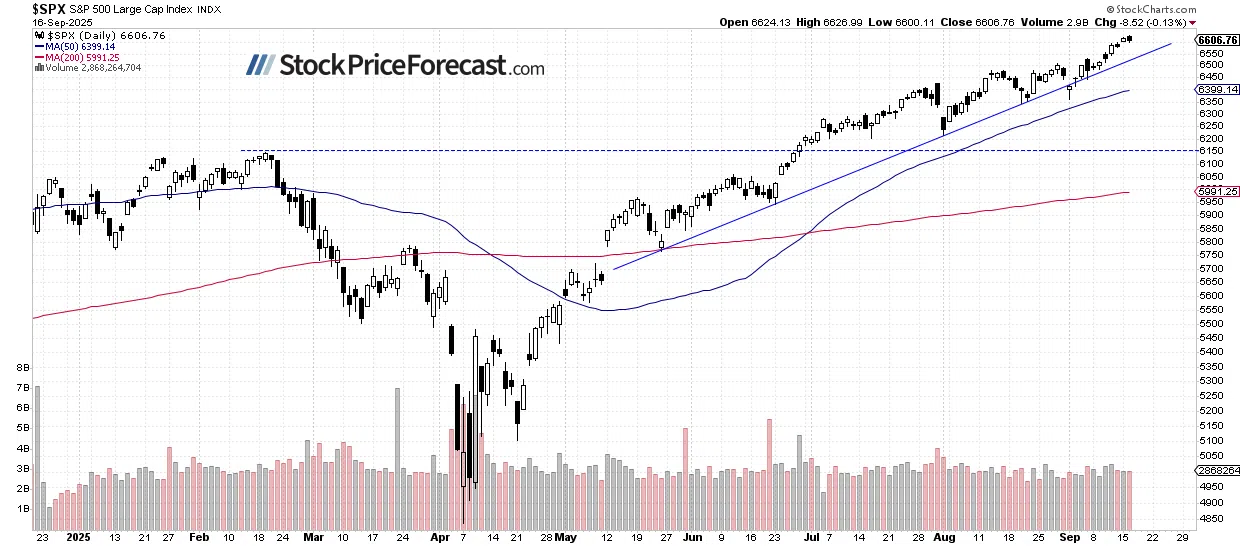
The CPI release led to another stock market advance yesterday, with the S&P 500 index reaching a new local high of 5,463.22 and closing 0.38% higher. This slightly extended the "V" rebound following last Monday's dip to a local low of 5,119.26. The question remains: is this still just an upward correction, or is it an uptrend leading to new all-time highs? This morning, the S&P 500 is likely to open 0.7% higher after a better-than-expected Retail Sales report and WMT earnings. It still appears to be a correction following a decline that started in mid-July; however, the market may also advance towards a double-top or new highs.
Investor sentiment improved, as indicated by yesterday's AAII Investor Sentiment Survey, which showed that 42.5% of individual investors are bullish, while 28.9% of them are bearish – down from 37.5% last week.
The S&P 500 index extended its gains after breaking the 5,400 level, as we can see on the daily chart.
(Click on image to enlarge)

Nasdaq 100 Remains Above 19,000
The technology-focused Nasdaq 100 accelerated its short-term uptrend on Tuesday, and yesterday, it gained just 0.09%, lagging behind the broader stock market amid mixed FANG stocks performance. This morning, the Nasdaq 100 is likely to open 0.9% higher, and it may get near the early August high.
(Click on image to enlarge)

VIX: Even Lower
Last Monday, the VIX index, a measure of market fear, reached a new long-term high of 65.73 - the highest level since the 2008 financial crisis and the COVID sell-off in 2020. This reflected significant fear in the market. However, since then, it has been retracing, and yesterday, it dropped as low as 16.12, indicating much less fear.
Historically, a dropping VIX indicates less fear in the market, and rising VIX accompanies stock market downturns. However, the lower the VIX, the higher the probability of the market’s downward reversal. Conversely, the higher the VIX, the higher the probability of the market’s upward reversal.
(Click on image to enlarge)

Gold sold off a bit, failing to hold above the previous high, but given the move up in stocks, it had a limited impact on silver, miners, and FCX. Those of you who have been shorting GDXJ and FCX in the recent weeks (about which I’ve been writing in my analyses) are likely happy with their performance despite the most recent run-up.
Are stocks really bullish here? Absolutely not. The world stocks chart suggests that the opposite is the case.
(Click on image to enlarge)

After failing to hold above their 2007 and 2021/2022 highs, world stocks declined. Right now, they rebounded, but the key thing remains intact – the breakout was invalidated.
Remember when I emphasized how bearish it was in case of copper back in May?
(Click on image to enlarge)

Copper plunged in the following weeks, and it seems that the decline is far from being over.
The same fate most likely awaits world stocks (and also U.S. stocks).
Also, the USD Index is likely forming a major bottom here.
Why would I say so?

First of all, the USD Index is after a relatively small (compared to the length of the line) breakdown below the rising black support line. This might be viewed as bearish, but actually it’s bullish because the USD Index rallied back up strongly after each previous breakdown – they were all invalidated.
Second, the USD Index is after a breakout above the declining, medium-term resistance line. The recent move lower made the USD Index move back to this line, but not below it. This way, the breakout is likely to be verified.
Third, it’s about TIME for the USD Index to form a major bottom, as it tends to do so close to the middle of the year. Precisely, that’s when the USD Index tends to reverse in a meaningful way, but since the recent move was to the downside, the implications are bullish.
Let’s zoom in.

The USD Index just formed a bullish reversal candlestick and along with the early-August reversal, it creates a double-bottom pattern. The same kind of pattern triggered rallies from almost the same price levels in mid-March.
The previous attempt of the USD index to move below its 61.8% Fibonacci retracement based on this year’s rally was invalidated and (also given today’s move up) it seems that we’ll see this kind of invalidation once again.
Looking beyond charts – with the looming liquidity problems given the reversal of the yen carry trade, many asset prices (such as stocks and commodities) are likely to decline. We saw something similar in 2008 when we had bankruptcy-driven liquidity problems – the USD Index soared sharply back then.
Moving back to charts, the key component of the USD Index – the euro – remains in a long-term downtrend, and it appears to be ready to move lower once again.

What may look like a bullish breakout on euro’s short-term chart, is just a tiny move above the declining, red resistance line. All previous breakouts (2014, 2020/2021) were invalidated and followed by declines.
Is this time any different, or is the history about to rhyme? The latter tends to happen much more frequently in the markets. Consequently, the odds are that the euro will decline and the USD Index will rally.
And since big moves up in the USD Index (unless triggered by serious geopolitical turmoil) lead to big moves down in the precious metals market, we have yet another reason to expect a bigger decline in the precious metals market in the following weeks. This is regardless of any short-term price moves that we saw or may see this week.
More By This Author:
Stocks: More Uncertainty Ahead Of Inflation DataContinued Uncertainty in the Stock Market
Stocks Rebounded: What’s Next?


Comments
Log in or sign up to join the conversation.