
Stock Market Irrational Exuberance Expectations And Valuation Analysis
What actually moves stocks? Stocks can go up, down, sideways depending on fundamentals, growth prospects, business and economic cycles, financial news and reports released by investment banks or brokers. A few years ago I wrote an article titled Irrational Exuberance Expectations And Valuation Analysis. I focused on four specific stocks, and now it is time to share my thoughts on them again, using basically the same idea, irrational exuberance and valuation for all these stocks. These are the four popular stocks; for each I will mention the weekly chart, as it is more representative for the longer trend analysis.
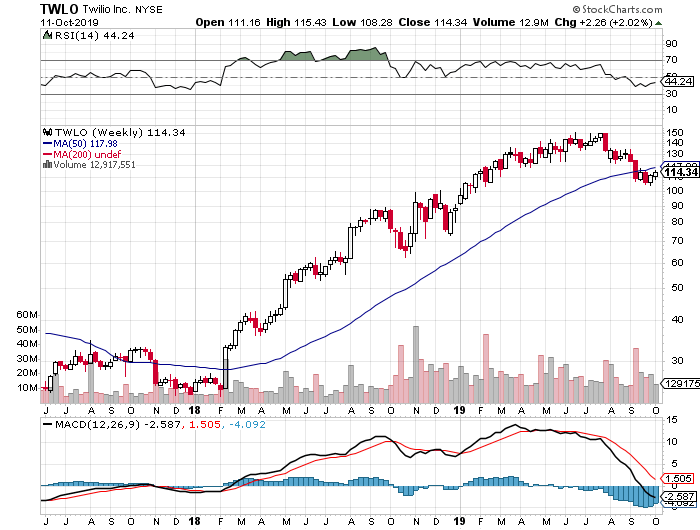
1. Twilio Inc. (NYSE: TWLO)
Twilio Inc. for the period of 2015 – 2018 had negative operating income and negative net income for all years, increasing revenue for all years, free cash flows that are positive but not strong, and cash flows from operating activities that are both negative and positive. Recent chart:
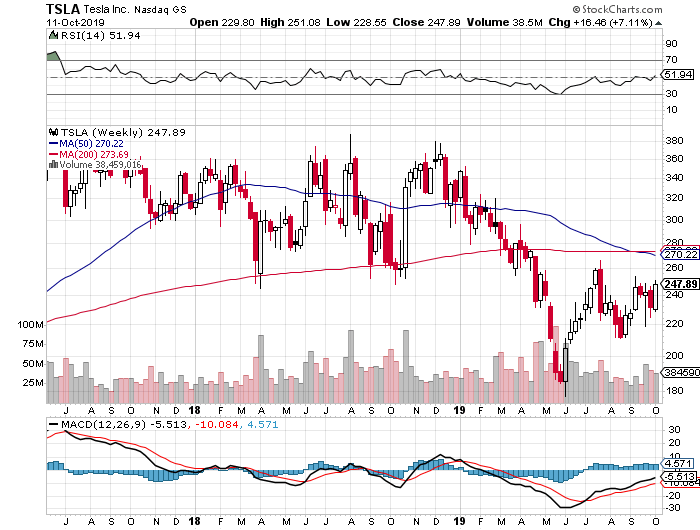
2. Tesla, Inc. (NASDAQ: TSLA)
Tesla, for the same period 2015-2018, has negative operating income and net income for all years, increasing revenue for all years, positive cash flows from operating activities only in 2018, and positive free cash flows for all years. Recent chart:
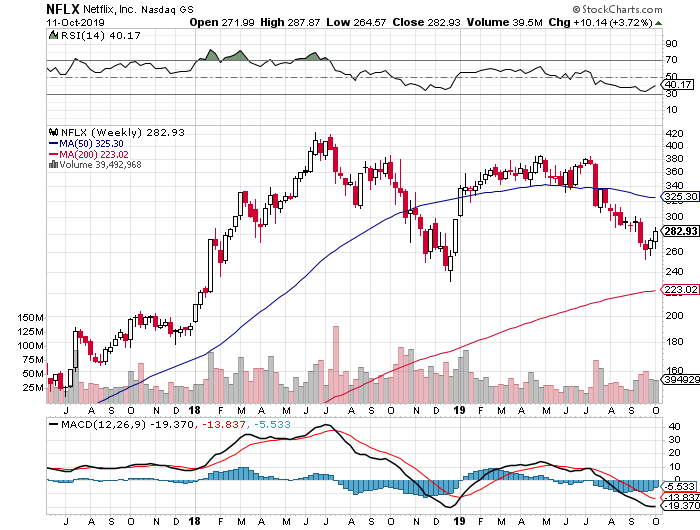
3. Netflix, Inc.. (NASDAQ: NFLX)
Netflix has increased revenue for all years from 2015-2018; it shows positive and increasing operating income and net income for all years, negative cash flows from operating activities, and also negative free cash flows for all years. Recent chart:
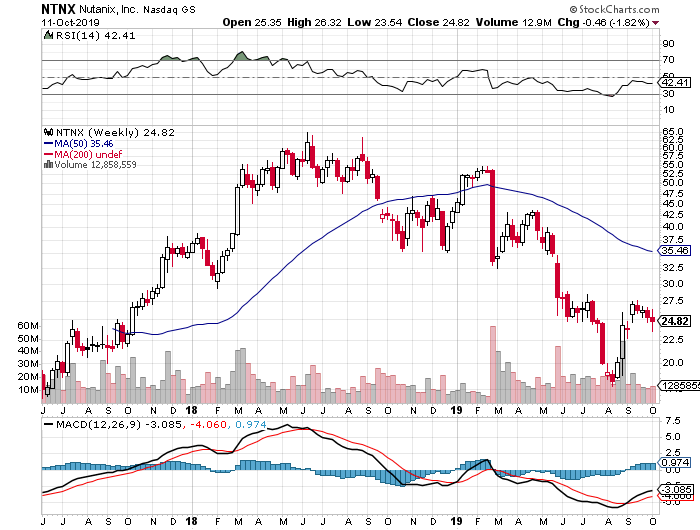
4. Nutanix, Inc. (NASDAQ: NTNX)
Nutanix, Inc. for the years 2016 – 2019 has increased revenue for all years, negative operating income and net income for all years, positive cash flows from operating activities and positive free cash flows for all years.
I focused only a few but very important financial metrics and their trend as my argument is that investors and traders must analyze stocks both for their profitability and their valuation. All of these stocks with the exception of Netflix have very important negative financial performance in terms of profitability, they have losses. Netflix is profitable but its stock has a recent P/E ratio of 112.91, whereas the current P/E ratio for S&P 500 is 22.10.
Catalysts such as competition can make a huge impact on all of these mentioned stocks. At some point their stock price moved to the zone of irrational exuberance compared to their intrinsic value. And though all of them were momentum stocks, financial analysis and valuation reveals another story. At some point investors and traders realize that there must be a turning point from being irrational about their stock market price to being more rational as their valuation is much lower based on their fundamentals.
Sources: Money MSN, Stockcharts.com , https://www.multpl.com/s-p-500-pe-ratio
Note: The time period for the stocks are weekly charts taken from stockcharts.com. The financial performance is annual data taken from Money MSN, so the charts do not cover the full time period mentioned for my financial analysis, only the weeks specified by the charting software.
Disclosure: I do not own or have sold any shares of the mentioned companies. The opinion and analysis is my own independent research and I do not get paid by any third party for this analysis.


Thanks for sharing.
Thank you for the comment.