Starbucks Signals Next Investment Move
Amid the ever-evolving landscape of global markets, Starbucks Corporation (NASDAQ: SBUX) stands as a recognizable and influential player. In this article, we dive into the current status of SBUX, exploring its recent market movement and projecting its future growth potential based on the Elliott Wave Theory.
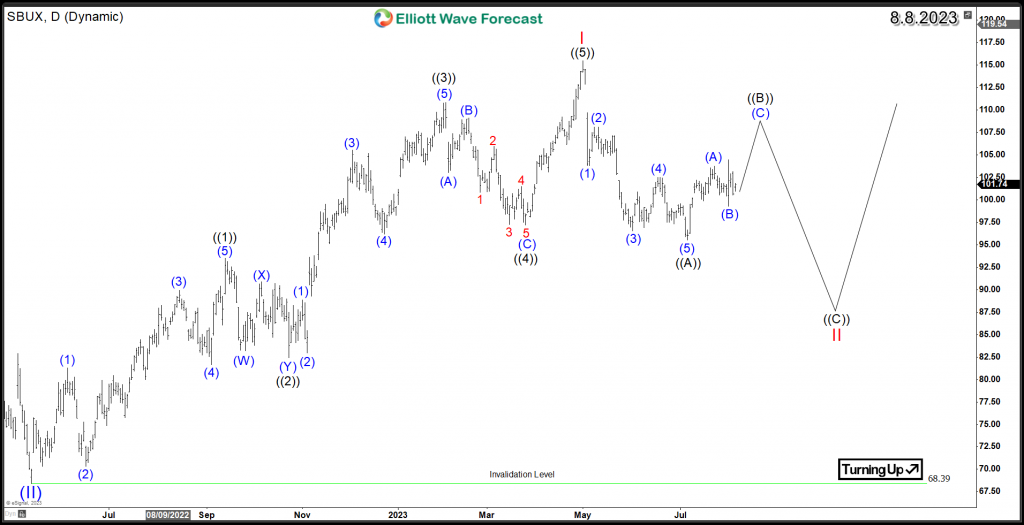
The daily chart reveals SBUX’s impulsive 5-wave rally from May 2022, marking new highs in May 2023 at $115.48. This 1-year surge represents wave I, with a corrective wave II expected to follow. Wave ((A)) saw a 5-wave decline, implying that Starbucks’s bounce in wave ((B)) is likely a correction, staying below $115. Wave ((C)) could drive the stock to $91 – $86, a potential buy zone for a bullish continuation.
Starbucks daily correction should hold above $68.39, enabling a bullish trend continuation. Investors eye a 3-swing correction as an early opportunity to join the trend.
SBUX Daily Elliott Wave Chart 8.8.2023
(Click on image to enlarge)
The following video offers a mid-term outlook and investment potential using Starbucks’s Elliott Wave analysis, alongside various potential scenarios that could affect the outcome.
More By This Author:
Elliott Wave Zig Zag Pattern Forecasting The Path For The Dollar IndexVale SA Price Action Signals Further Upside
Forex Vs. Options Trading: Which Is Better?
Disclaimer: Futures, options, and over the counter foreign exchange products may involve substantial risk and may not be suitable for all investors. Leverage can work against you as well as for ...
more


