SPX Is Looking To Finish A Cycle Towards A Blue Box
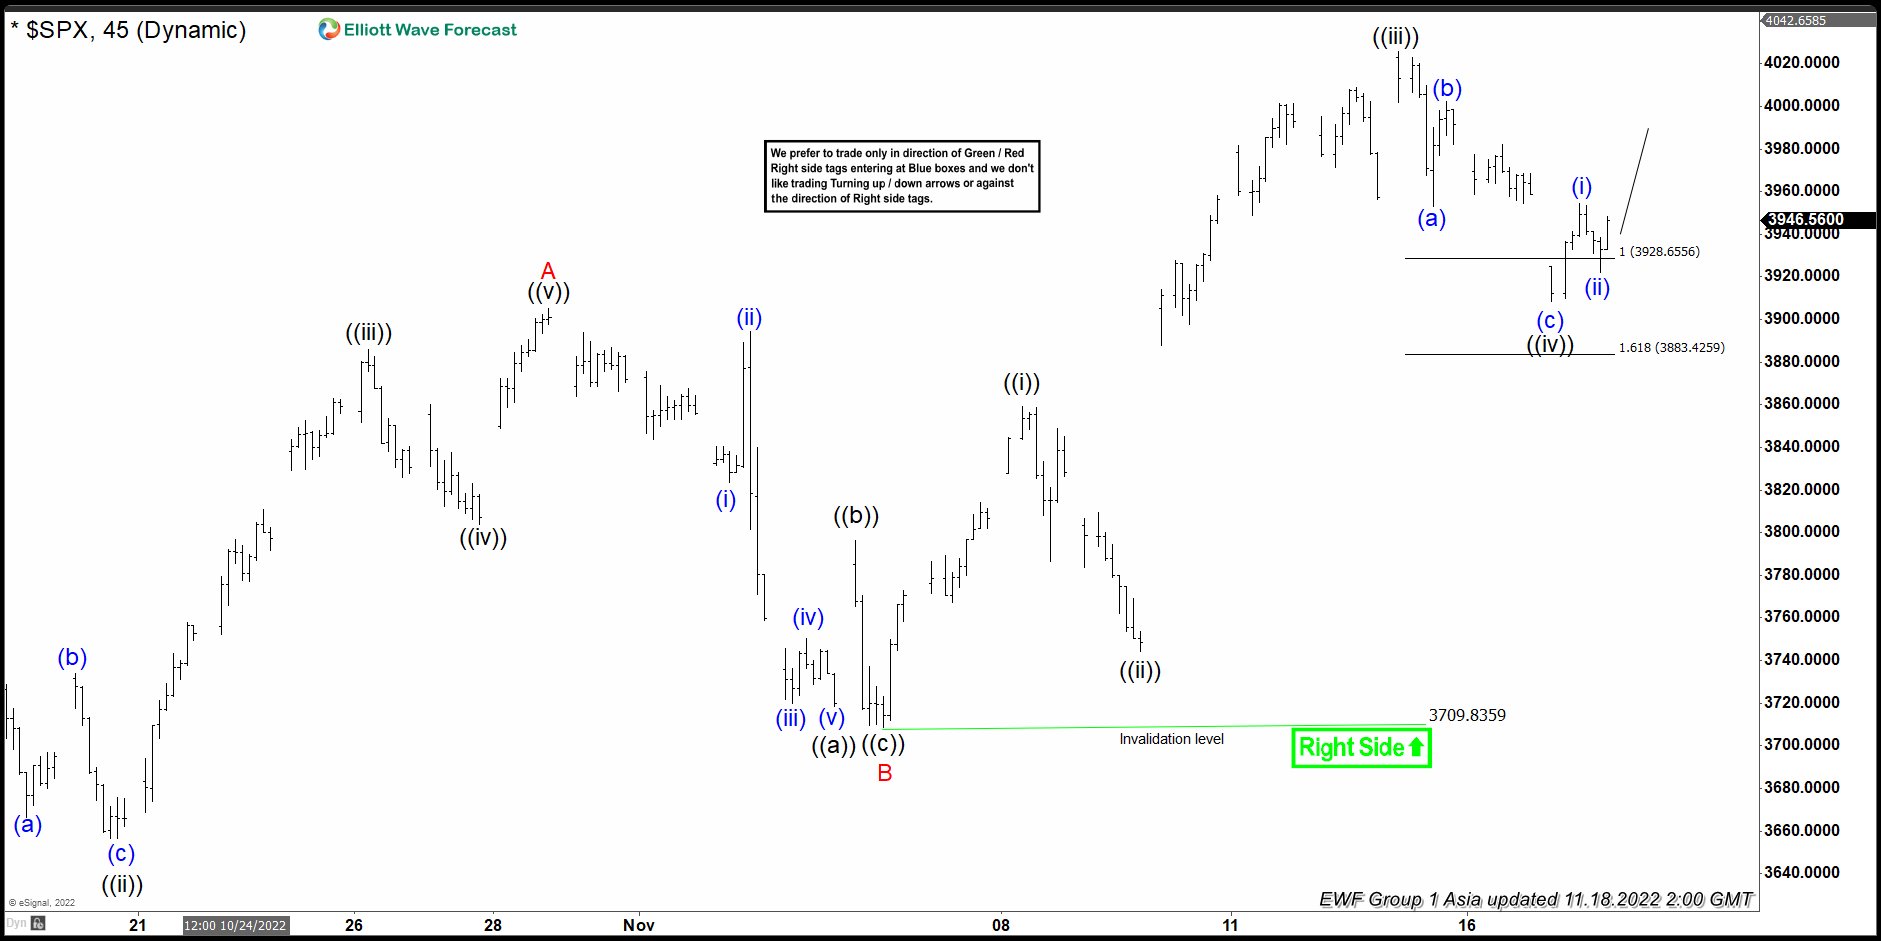
Short-term Elliott Wave View in S&P 500 (SPX) shows an incomplete bearish sequence from the 1.04.2022 high favoring further downside. The short-term, rally from the 10.13.2022 low is unfolding as a zigzag Elliott Wave structure. Up from the 10.13.2022 low, wave A ended at 3905.64, and a pullback in wave B ended at 3709.83. Wave C higher is in progress as a 5 waves impulse structure before the Index turns lower again.
Up from wave B, wave ((i)) ended at 3859.84, and a pullback in wave ((ii)) ended at 3743.57. The index then rallies again in wave ((iii)) towards 4025.94. Internal subdivision of wave ((iv)) takes the form of a zigzag correction. Down from wave ((iii)), wave (a) ended at 3951.95, and rally in wave (b) ended at 4002.79. Wave (c) finished at 3908.16 and also wave ((iv)). Rally as wave ((v)) has started and as far as pivot at 3908.16 low stays intact, expect the Index to extend higher 1 more leg. The potential target is a 100% – 161.8% Fibonacci extension from the 10.13.2022 low which comes at the 4080.43 – 4312.02 area.
SPX 45 Minutes Elliott Wave Chart
(Click on image to enlarge)
More By This Author:
Infineon Technologies Provides An Opportunity In A PullbackNike Inc. Perfect Reaction Lower from Blue Box Area.
USDCAD Elliott Wave: Buying The Dips At The Blue Box Area
Disclaimer: Futures, options, stocks, ETFs and over the counter foreign exchange products may involve substantial risk and may not be suitable for all investors. Leverage can work against you as ...
more


