SPX Elliott Wave : Incomplete Sequences Calling The Decline
Image Source: Unsplash
In this technical article, we’re going to look at the Elliott Wave charts of the SPX Index published in the members area of the website. As our members know, SPX has shown incomplete bearish sequences in the cycle from the February 19th peak. The price structure indicated further weakness. In the following text, we will provide a more detailed explanation of the Elliott Wave forecast.
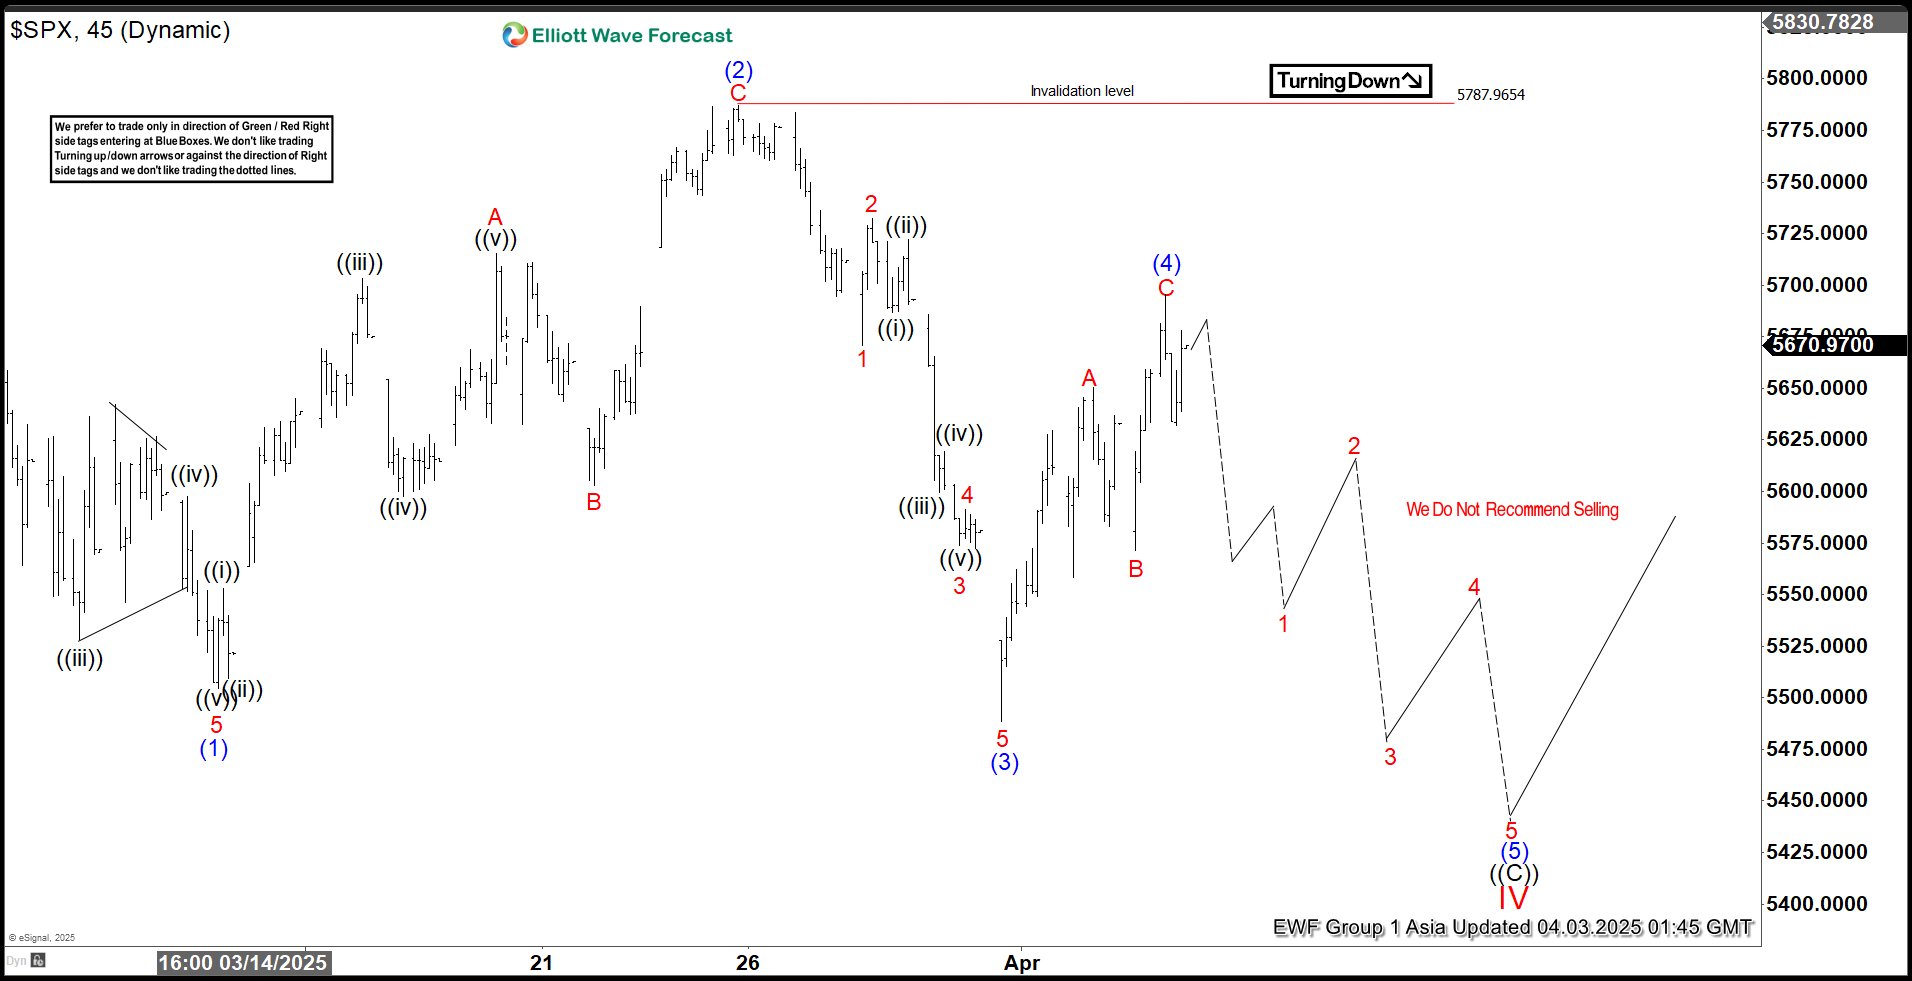
SPX Elliott Wave 1 Hour Asia Chart 04.03.2025
Current Elliott Wave analysis suggests that SPX has completed a three-wave recovery against the 5787.96 high, marked as wave (4) blue. As long as the price remains below the 5694 level, we consider wave (4) blue to be complete and expect a continued downside in SPX towards new lows.
90% of traders fail because they don’t understand market patterns.
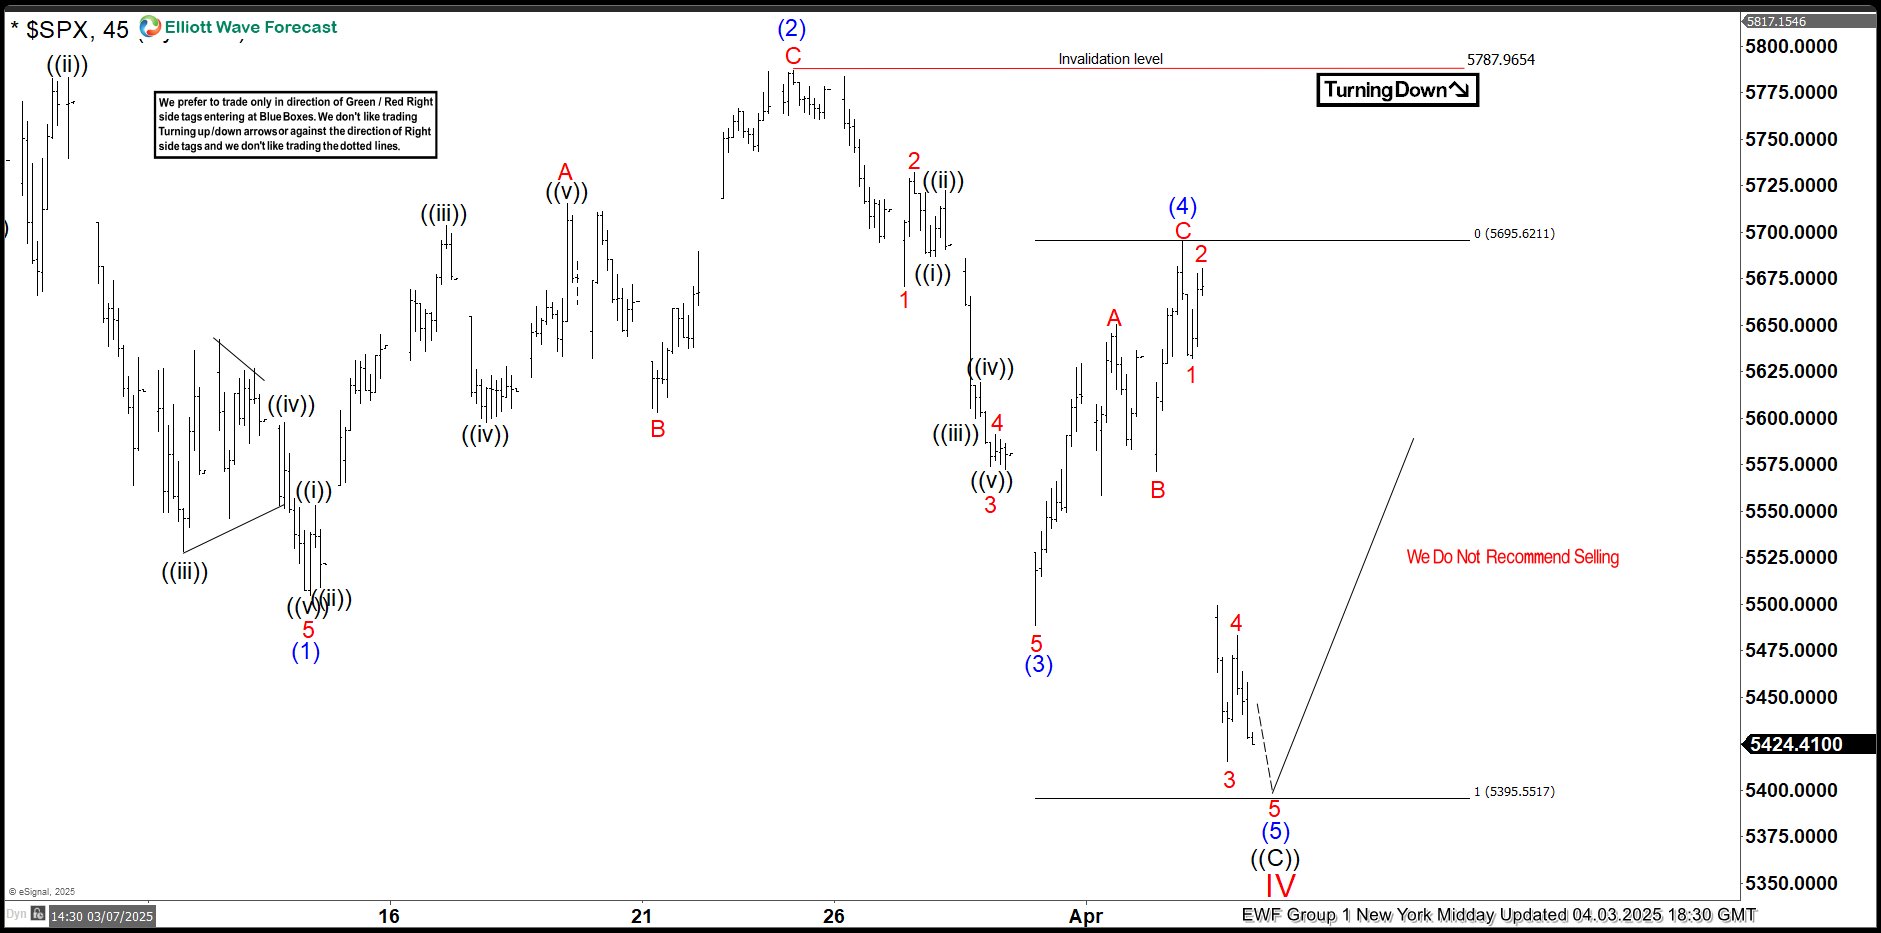
SPX Elliott Wave 1 New York Midday Hour Chart 04.03.2025
The price remained below the 5694 level, and as expected, the decline occurred. The price broke to new lows, confirming that wave (5) is in progress. We are now looking for further short-term weakness, with the next target around the 5395.55 area.
More By This Author:
Apple Gains Momentum With 5 Swing Rally, Upside LikelyThe DAX Is Declining In An Impulsive Structure, According To Elliott Wave Perspective
Elliott Wave Perspective: Dow Futures (YM) Poised To Continue Its Rally
Disclaimer: Futures, options, and over the counter foreign exchange products may involve substantial risk and may not be suitable for all investors. Leverage can work against you as well as for ...
more


