

Spotify Technology S.A. (NYSE: SPOT) struck a deal Thursday with Warner Music Group Corporation (NASDAQ: WMG) to leverage Warner’s catalog of arts, songwriters, and music to create original podcasts.
The news came at the perfect time on Spotify’s stock chart and helped to confirm the break of a bullish pattern.
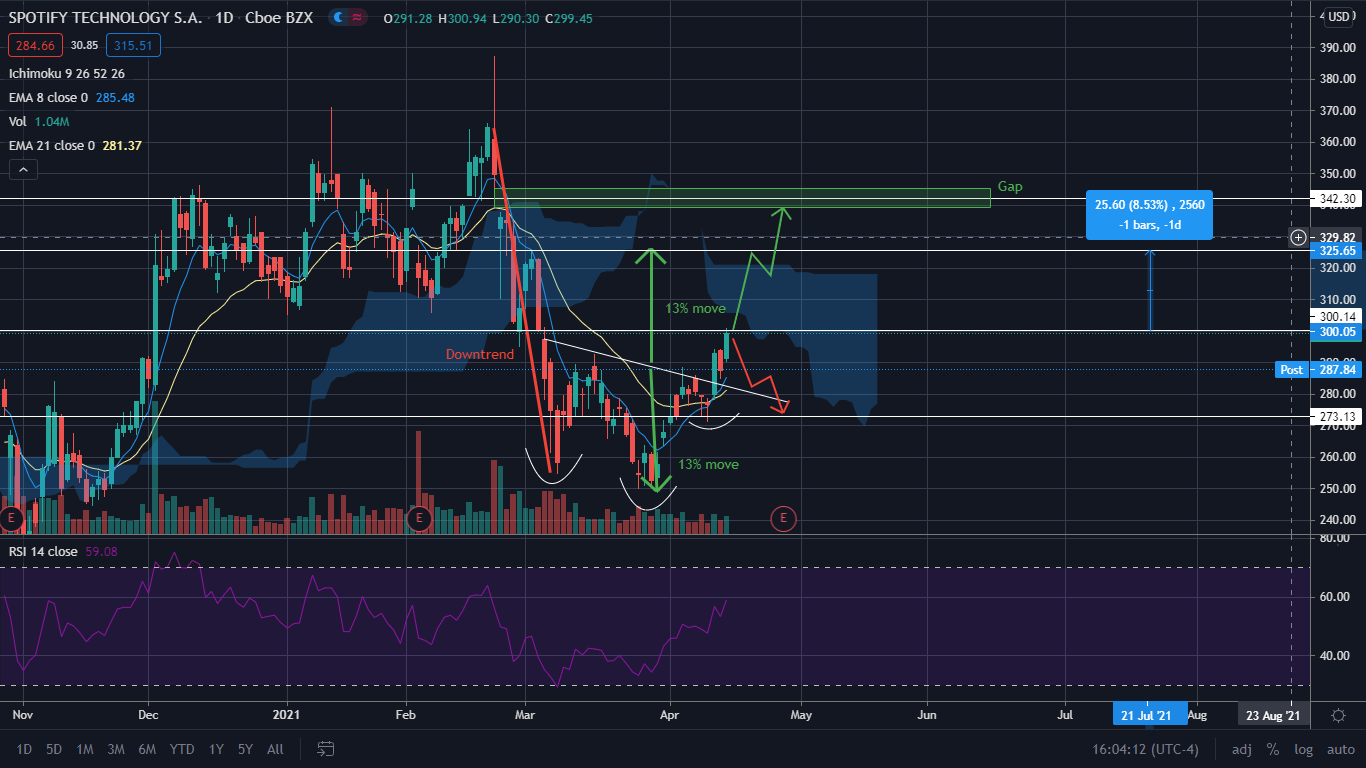
The Spotify Chart: Spotify's stock closed a hair below resistance at $299.45. From March 4 through to April 13, Spotify’s stock fell into a bullish inverted head-and-shoulder pattern. An inverted head-and-shoulder pattern can come at the bottom of a downtrending stock and is considered a reversal pattern.
On March 31, Spotify’s stock jumped up over resistance at $266.15 and completed the head and right shoulder of the pattern over the following eight trading days. This gave traders and investors the information needed to draw the sloping neckline of the pattern. On April 13, the eight-day exponential moving average (EMA) crossed above the 21-day EMA, which is bullish, and the stock made a 5% move North. It's now trading above both commonly followed EMAs.
The measured move of a head-and-shoulders pattern is calculated by measuring the distance from the neckline to the tip of the head. In Spotify’s case, the distance is 13%. Technical traders can then measure 13% in the opposite direction of the head to see the measured move. The measured move indicates the level a stock could move to if it completes the pattern. In Shopify’s case, the share price could reach $325.73, which aligns perfectly with the next level of overhead resistance on the chart.
Bulls want to see the pattern completed, which would produce an 8.5% return from Thursday’s closing price and for Spotify to clear $300 on Friday. On completion of the pattern, Shopify’s stock may consolidate under the next resistance before pushing over it. If the stock can clear resistance at $325.73, it could head towards the $342 area where there is both another area of resistance and a gap.
Bears want to see the measured move stall and for Spotify to fall back to the neckline. If Spotify’s stock drops below the neckline, it could fall to the next support area at $266.15.


Comments
Log in or sign up to join the conversation.